Napa Auto Parts 2004 Annual Report Download - page 18
Download and view the complete annual report
Please find page 18 of the 2004 Napa Auto Parts annual report below. You can navigate through the pages in the report by either clicking on the pages listed below, or by using the keyword search tool below to find specific information within the annual report.-
 1
1 -
2
-
3
-
4
-
5
-
6
-
7
-
 8
8 -
 9
9 -
 10
10 -
 11
11 -
 12
12 -
 13
13 -
 14
14 -
 15
15 -
 16
16 -
 17
17 -
 18
18 -
 19
19 -
 20
20 -
 21
21 -
 22
22 -
 23
23 -
 24
24 -
 25
25 -
 26
26 -
 27
27 -
 28
28 -
29
-
30
-
31
-
32
-
33
-
34
-
35
-
36
-
37
-
38
-
39
-
40
-
41
-
42
-
43
-
44
 |
 |

16
management’s discussion and analysis of financial condition and results of operations
(continued)
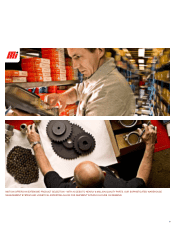
Industrial Group
Net sales for Motion Industries, our Industrial Group (“Industrial”),
were $2.5 billion in 2004, an 11% increase compared to 2003.
Improved economic conditions across our industrial customer
base helped to significantly improve our growth opportunities
relative to the last few years. After high single digit percentage
growth in revenues in the first quarter, growth in the remaining
quarters of 2004 improved, with increases ranging from low
double-digit rates to those in the mid-teens. Industrial sales were
$2.3 billion in 2003, only a slight increase over 2002, and the
two years before that were equally difficult periods, as weak
conditions were pervasive in the markets served by Industrial.
U.S. industrial production and factory utilization statistics began
to show some improving trends late in 2003. These remained
strong throughout 2004, and the continued strength of the
production and utilization numbers is encouraging as we look
ahead to 2005.
Office Group
Net sales for S.P. Richards, our Office Products Group (“Office”),
were $1.54 billion, up 6% over 2003. Revenue growth at Office
was generally consistent from quarter to quarter in 2004,
although its best performance was in the third quarter. In 2004,
sales increases in the office furniture category and at our
Canadian operations helped lead Office to its strongest sales
growth in several years. Office sales were $1.46 billion in 2003,
up 4% over 2002. Office typically generates our steadiest results
from year to year, despite the changes in the economic climate.
This is accomplished through the continuous expansion of our
product and service offerings, as well as initiatives to expand
our customer base.
Electrical Group
Net sales for EIS, our Electrical and Electronic Group (“Electrical”),
were up 13% to $336 million in 2004, its best performance in
several years. As Electrical’s growth opportunities depend on the
manufacturing sector of the economy, the improved conditions
we began to see late in 2003 continued into 2004, positively
impacting our results. Electrical sales were down 6% to $298
million in 2003 from the prior year. This was the third year of a
downward trend in Electrical revenues, reflecting the difficult
economic environment in which Electrical operated during the
three years preceding 2004. We were encouraged, however, that
the sales decrease in 2003 was less than the declines reported
in the prior two years, and fourth quarter revenues were up
slightly compared to the same period in 2002.
Cost of Goods Sold/Expenses
Cost of goods sold in 2004 was 68.9% of net sales compared to
69.0% in 2003. Selling, administrative and other expenses (“SG&A”)
of $2.2 billion were 24.1% of sales compared to 24.3% last year.
The slight decrease in cost of goods sold as a percentage of sales
reflects our on-going efforts to improve our gross margins.
Initiatives to enhance our pricing strategies, promote and sell
higher margin products and minimize material acquisition costs
are examples of the efforts we have made to reduce our cost of
goods sold as a percentage of sales. These initiatives were
developed to offset the usual competitive pricing pressures as
well as lower levels of vendor discounts and volume incentives
earned for the year, especially in Industrial. In 2004, the impact
of vendor discounts and volume incentives was less than in
2003. The decrease in SG&A expenses as a percentage of sales
reflects the savings associated with our initiatives to control costs.
These initiatives include tight controls over operating expenses
as well as continuous improvement programs designed to optimize
our utilization of people and systems.
Cost of goods sold was 69.0% of net sales in 2003 compared
to 69.1% in 2002. SG&A expenses of $2.1 billion were 24.3%
of sales compared to 23.6% in 2002. The decrease in cost of
goods sold and the increase in SG&A expenses reflect our
reclassification in 2003 of certain vendor consideration associated
with the adoption of EITF 02-16 as defined below. Before the
reclassification, cost of goods sold in 2003 was 70.2% of sales
and SG&A expenses were 23.1% of sales. This increase in cost
of goods sold as a percentage of 2003 net sales was due to
lower levels of vendor discounts and volume incentives related
to purchases, overall competitive pricing pressures and product
and customer mix. The comparable decrease in SG&A expenses
reflects our on-going cost savings initiatives.
Effective January 1, 2003, the Company was required to adopt
the Financial Accounting Standards Board Emerging Issues Task
Force’s Issue No. 02-16, related to the accounting treatment of
cash consideration received from vendors (“EITF 02-16”). This
encompasses certain advertising and promotional allowances,
catalog support and other cash support arrangements that normally
exist among retailers and distributors with their vendors. We
historically classified certain vendor monies received, primarily
advertising related, as a component of SG&A expenses. Under
the new EITF 02-16, these vendor monies must be classified as
cost of goods sold and a portion of the amounts must be capi-
talized into ending inventory. In connection with the January 1,
2003 adoption of EITF 02-16, we recorded a cumulative effect
adjustment of approximately $19.5 million in 2003. In addition,
we reclassified approximately $102.2 million from SG&A expenses
to cost of goods sold in 2003. Under EITF 02-16, prior periods
were not reclassified.
Operating Profit
Operating profit as a percentage of net sales was 8.1% in 2004
compared to 7.9% in 2003. These results reflect the improvement
in our revenue, gross margins and SG&A expenses as a
percentage of sales. The challenges associated with reduced
vendor discounts and volume incentives, as well as expense
increases such as employee benefits, insurance and legal and
professional costs, prevented us from achieving greater gains in
our 2004 operating profits. Operating profit as a percentage of
sales was 7.9% in 2003 compared to 8.5% in 2002. These results
reflect our decrease in comparable gross margins, as well as an
environment of rising pension and healthcare costs and the overall
economic conditions in certain markets, which constrained our
sales opportunities in 2003.
Automotive Group
Automotive operating margins increased to 8.4% in 2004 from
8.1% in 2003. The increase reflects the impact on sales of positive
industry trends and improved economic conditions, in addition
to the success of our internal initiatives. Automotive operating
margins decreased to 8.1% in 2003 from 8.8% in 2002, primarily
due to pricing pressures combined with increases in salaries,