NVIDIA 2011 Annual Report Download - page 93
Download and view the complete annual report
Please find page 93 of the 2011 NVIDIA annual report below. You can navigate through the pages in the report by either clicking on the pages listed below, or by using the keyword search tool below to find specific information within the annual report.-
 1
1 -
2
-
3
-
4
-
5
-
6
-
7
-
8
-
9
-
10
-
11
-
12
-
13
-
14
-
15
-
16
-
17
-
18
-
19
-
20
-
21
-
22
-
23
-
24
-
25
-
26
-
27
-
28
-
29
-
30
-
31
-
32
-
33
-
34
-
35
-
36
-
37
-
38
-
39
-
40
-
41
-
42
-
43
-
44
-
45
-
46
-
47
-
48
-
49
-
50
-
51
-
52
-
53
-
54
-
55
-
56
-
57
-
58
-
59
-
60
-
61
-
62
-
63
-
64
-
65
-
66
-
67
-
68
-
69
-
70
-
71
-
72
-
73
-
74
-
75
-
76
-
77
-
78
-
79
-
80
-
81
-
82
-
 83
83 -
 84
84 -
 85
85 -
 86
86 -
 87
87 -
 88
88 -
 89
89 -
 90
90 -
 91
91 -
 92
92 -
 93
93 -
 94
94 -
 95
95 -
 96
96 -
 97
97 -
 98
98 -
 99
99 -
 100
100 -
 101
101 -
 102
102 -
 103
103 -
104
-
105
-
106
-
107
-
108
-
109
-
110
-
111
-
112
-
113
-
114
-
115
-
116
 |
 |
NVIDIA CORPORATION AND SUBSIDIARIES
NOTES TO THE CONSOLIDATED FINANCIAL STATEMENTS
(Continued)
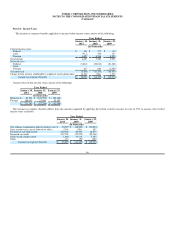
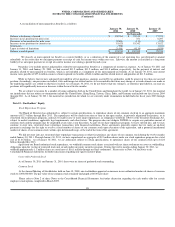
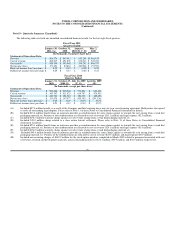
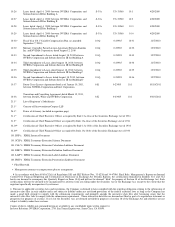
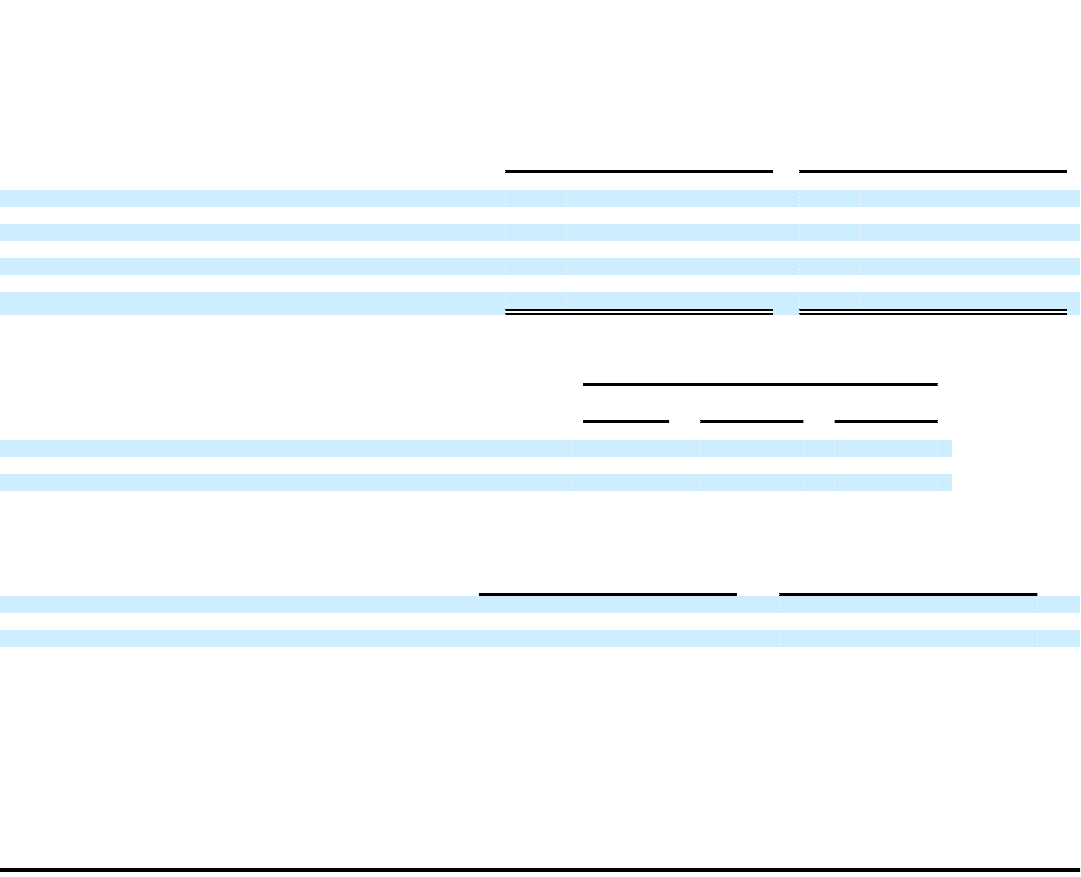
The following table presents summarized information for long-lived assets by geographic region. Long lived assets consist of property and equipment
and deposits and other assets and exclude goodwill and intangible assets.
January 30,
2011 January 31,
2010
Long-lived assets: (In thousands)
United States $ 529,797 $ 468,568
Taiwan 56,202 69,051
China 32,500 39,124
India 31,454 32,070
Europe 4,541 5,603
Other Asia Pacific 787 370
Total long-lived assets $ 655,281 $ 614,786
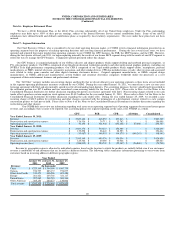
Revenue from significant customers, those representing 10% or more of total revenue for the respective dates, is summarized as follows:
Year Ended
January 30,
2011 January 31,
2010 January 25,
2009
Revenue:
Customer A 12 % 12 % 7%
Customer B 8 % 9 % 8%
Customer C 6 % 7 % 11%
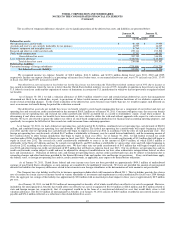
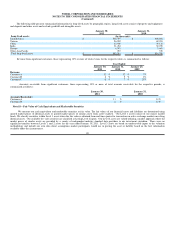
Accounts receivable from significant customers, those representing 10% or more of total accounts receivable for the respective periods, is
summarized as follows:
January 30,
2011 January 31,
2010
Accounts Receivable:
Customer A 11 % 10%
Customer B 6 % 10%
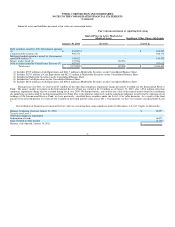
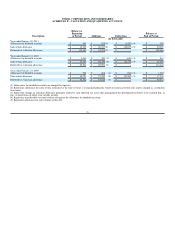
Note 18 – Fair Value of Cash Equivalents and Marketable Securities
We measure our cash equivalents and marketable securities at fair value. The fair values of our financial assets and liabilities are determined using
quoted market prices of identical assets or quoted market prices of similar assets from active markets. Our Level 1 assets consist of our money market
funds. We classify securities within Level 1 assets when the fair value is obtained from real time quotes for transactions in active exchange markets involving
identical assets. Our available-for- sale securities are classified as having Level 2 inputs. Our Level 2 assets are valued utilizing a market approach where the
market prices of similar assets are provided by a variety of independent industry standard data providers to our investment custodian. There were no
significant transfers between Levels 1 and 2 assets for the year ended January 30, 2011. Level 3 assets are based on unobservable inputs to the valuation
methodology and include our own data about assumptions market participants would use in pricing the asset or liability based on the best information
available under the circumstances.
90