NVIDIA 2011 Annual Report Download - page 50
Download and view the complete annual report
Please find page 50 of the 2011 NVIDIA annual report below. You can navigate through the pages in the report by either clicking on the pages listed below, or by using the keyword search tool below to find specific information within the annual report.-
 1
1 -
2
-
3
-
4
-
5
-
6
-
7
-
8
-
9
-
10
-
11
-
12
-
13
-
14
-
15
-
16
-
17
-
18
-
19
-
20
-
21
-
22
-
23
-
24
-
25
-
26
-
27
-
28
-
29
-
30
-
31
-
32
-
33
-
34
-
35
-
36
-
37
-
38
-
39
-
 40
40 -
 41
41 -
 42
42 -
 43
43 -
 44
44 -
 45
45 -
 46
46 -
 47
47 -
 48
48 -
 49
49 -
 50
50 -
 51
51 -
 52
52 -
 53
53 -
 54
54 -
 55
55 -
 56
56 -
 57
57 -
 58
58 -
 59
59 -
 60
60 -
61
-
62
-
63
-
64
-
65
-
66
-
67
-
68
-
69
-
70
-
71
-
72
-
73
-
74
-
75
-
76
-
77
-
78
-
79
-
80
-
81
-
82
-
83
-
84
-
85
-
86
-
87
-
88
-
89
-
90
-
91
-
92
-
93
-
94
-
95
-
96
-
97
-
98
-
99
-
100
-
101
-
102
-
103
-
104
-
105
-
106
-
107
-
108
-
109
-
110
-
111
-
112
-
113
-
114
-
115
-
116
 |
 |

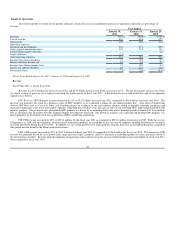
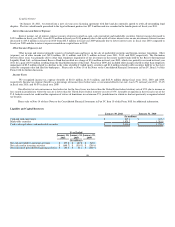
Investing activities for fiscal year 2010 used cash of $441.5 million towards the purchase of marketable securities, net of proceeds from sales of
marketable securities. Additionally, we used $77.6 million towards capital expenditures in fiscal year 2010. Capital expenditures included purchase of new
research and development equipment, testing equipment to support our increased production requirements, technology licenses, software, intangible assets
and leasehold improvements at our facilities in various international locations.
Investing activities for fiscal year 2009 used cash of $27.9 million in connection with our acquisition of Ageia and $407.7 million towards capital
expenditures, as we built additional facilities to accommodate our growing employee headcount, new research and development equipment, testing equipment
to support our increased production requirements, technology licenses, software, intangible assets and leasehold improvements at our facilities in various
international locations. Investing activities for capital expenditures in fiscal year 2009 also included payment of approximately $183.8 million for purchase of
a property in Santa Clara, California, that includes approximately 25 acres of land and ten commercial buildings. Our original plans for the purchased property
included constructing a new campus on the site. We are currently re-evaluating those plans. This cash outflow is offset by $226.7 million of cash from the net
proceeds from sales of marketable securities.
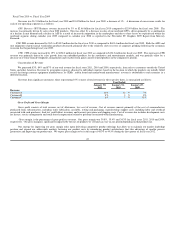
Financing activities
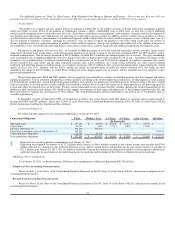
Financing activities provided cash of $192.0 million and $61.1 million during fiscal years 2011 and 2010 respectively, and used cash of $349.3
million during fiscal year 2009.
Net cash provided by financing activities in fiscal year 2011 was primarily due to cash proceeds of $177.3 million from common stock issued under
our employee stock plans, and a non-cash tax benefit of $15.3 million for the gross windfall related to employee stock based compensation.
Net cash provided by financing activities in fiscal year 2010 was primarily due to cash proceeds of $138.0 million from common stock issued under
our employee stock plans, offset by $78.1 million used for the purchase of outstanding stock options related to a tender offer that closed in March
2009. Please refer to Note14 of the Notes to the Consolidated Financial Statements in Part IV, Item 15 of this Form 10-K for further discussion regarding the
cash tender offer.
Net cash used by financing activities in fiscal year 2009 was primarily due to $423.6 million used in our stock repurchase program, offset by cash
proceeds of $73.5 million from common stock issued under our employee stock plans.
Liquidity
Our primary source of liquidity is cash generated by our operations. Our investment portfolio consisted of cash and cash equivalents, asset-backed
securities, commercial paper, mortgage-backed securities issued by government-sponsored enterprises, money market funds and debt securities of
corporations, municipalities and the United States government and its agencies. These investments are denominated in United States dollars. As of January 30,
2011, we did not have any investments in auction-rate preferred securities.
All of the cash equivalents and marketable securities are treated as “available-for-sale”. Investments in both fixed rate and floating rate interest
earning instruments carry a degree of interest rate risk. Fixed rate debt securities may have their market value adversely impacted due to a rise in interest rates,
while floating rate securities may produce less income than expected if interest rates fall. Due in part to these factors, our future investment income may fall
short of expectations due to changes in interest rates or if the decline in fair value of our publicly traded debt or equity investments is judged to be other-than-
temporary. We may suffer losses in principal if we are forced to sell securities that decline in market value due to changes in interest rates. However, because
any debt securities we hold are classified as “available-for-sale,” no gains or losses are realized in our statement of operations due to changes in interest rates
unless such securities are sold prior to maturity or unless declines in market values are determined to be other-than-temporary. These securities are reported at
fair value with the related unrealized gains and losses included in accumulated other comprehensive income, a component of stockholders’ equity, net of tax.
48