NVIDIA 2011 Annual Report Download - page 45
Download and view the complete annual report
Please find page 45 of the 2011 NVIDIA annual report below. You can navigate through the pages in the report by either clicking on the pages listed below, or by using the keyword search tool below to find specific information within the annual report.-
 1
1 -
2
-
3
-
4
-
5
-
6
-
7
-
8
-
9
-
10
-
11
-
12
-
13
-
14
-
15
-
16
-
17
-
18
-
19
-
20
-
21
-
22
-
23
-
24
-
25
-
26
-
27
-
28
-
29
-
30
-
31
-
32
-
33
-
34
-
 35
35 -
 36
36 -
 37
37 -
 38
38 -
 39
39 -
 40
40 -
 41
41 -
 42
42 -
 43
43 -
 44
44 -
 45
45 -
 46
46 -
 47
47 -
 48
48 -
 49
49 -
 50
50 -
 51
51 -
 52
52 -
 53
53 -
 54
54 -
 55
55 -
56
-
57
-
58
-
59
-
60
-
61
-
62
-
63
-
64
-
65
-
66
-
67
-
68
-
69
-
70
-
71
-
72
-
73
-
74
-
75
-
76
-
77
-
78
-
79
-
80
-
81
-
82
-
83
-
84
-
85
-
86
-
87
-
88
-
89
-
90
-
91
-
92
-
93
-
94
-
95
-
96
-
97
-
98
-
99
-
100
-
101
-
102
-
103
-
104
-
105
-
106
-
107
-
108
-
109
-
110
-
111
-
112
-
113
-
114
-
115
-
116
 |
 |

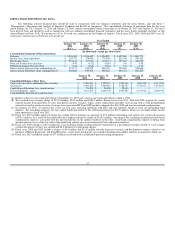
Fiscal Year 2010 vs. Fiscal Year 2009
Revenue was $3.33 billion for the fiscal year 2010 and $3.42 billion for fiscal year 2009, a decrease of 3%. A discussion of our revenue results for
each of our operating segments is as follows:
GPU Business. GPU Business revenue increased by 3% to $2.66 billion for fiscal year 2010 compared to $2.59 billion for fiscal year 2009. The
increase was primarily driven by sales of our ION products. This was offset by a decrease in sales of our notebook GPUs, driven primarily by a combination
of a decline in unit demand and a decline in ASP as a result of increased competition in the marketplace and due to share losses we experienced within the
notebook segment, during calendar year 2009 compared to calendar year 2008 as reported in the November PC Graphics 2009 Report from Mercury
Research.
PSB. PSB revenue decreased by 26% to $510.2 million for the fiscal year 2010 as compared to $693.4 million for fiscal year 2009. Both the ASPs and
unit shipments of professional workstation products decreased, primarily due to the relatively slow recovery of corporate spending following the economic
recession that began during fiscal year 2009.
CPB. CPB revenue increased by 15% to $156.0 million for fiscal year 2010 as compared to $136.3 million for fiscal year 2009. This increase in CPB
revenue was primarily driven by sales growth from our embedded products for the automotive and entertainment markets, and was partially offset by a
decrease in revenue from development arrangements and royalties from game console-related products in the comparative periods.
Concentration of Revenue
We generated 83%, 84% and 87% of our total revenue for fiscal years 2011, 2010 and 2009, respectively, from sales to customers outside the United
States and other Americas. Revenue by geographic region is allocated to individual countries based on the location to which the products are initially billed
even if the foreign contract equipment manufacturers, or CEMs’, add-in board and motherboard manufacturers’ revenue is attributable to end customers in a
different location.
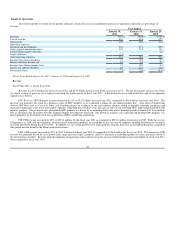
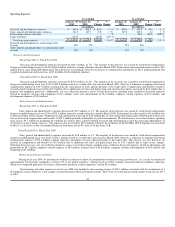
Revenue from significant customers, those representing 10% or more of total revenue for the respective dates, is summarized as follows:
Year Ended
January 30,
2011 January 31,
2010 January 25,
2009
Revenue:
Customer A 12 % 12 % 7%
Customer B 8 % 9 % 8%
Customer C 6 % 7 % 11%
Gross Profit and Gross Margin
Gross profit consists of total revenue, net of allowances, less cost of revenue. Cost of revenue consists primarily of the cost of semiconductors
purchased from subcontractors, including wafer fabrication, assembly, testing and packaging, manufacturing support costs, including labor and overhead
associated with such purchases, final test yield fallout, inventory and warranty provisions and shipping costs. Cost of revenue also includes development costs
for license, service arrangements and stock-based compensation related to personnel associated with manufacturing.
Gross margin is the percentage of gross profit to revenue. Our gross margin was 39.8%, 35.4% and 34.3% for fiscal years 2011, 2010 and 2009,
respectively. Our gross margin is significantly impacted by the mix of products we sell and can vary in any period depending on that product mix.
Our strategy for improving our gross margin relies upon delivering competitive product offerings that allow us to maintain our market leadership
position and expand our addressable markets, lowering our product costs by introducing product architectures that take advantage of smaller process
geometries and improving our product mix. We expect gross margin to be in the range of 48.5% to 49.5% during the first quarter of fiscal year 2012.
43