Mitsubishi 2015 Annual Report Download - page 9
Download and view the complete annual report
Please find page 9 of the 2015 Mitsubishi annual report below. You can navigate through the pages in the report by either clicking on the pages listed below, or by using the keyword search tool below to find specific information within the annual report.-
 1
1 -
 2
2 -
 3
3 -
 4
4 -
 5
5 -
 6
6 -
 7
7 -
 8
8 -
 9
9 -
 10
10 -
 11
11 -
 12
12 -
 13
13 -
 14
14 -
 15
15 -
 16
16 -
 17
17 -
 18
18 -
 19
19 -
 20
20 -
21
-
22
-
23
-
24
-
25
-
26
-
27
-
28
-
29
-
30
-
31
-
32
-
33
-
34
-
35
-
36
-
37
-
38
-
39
-
40
-
41
-
42
-
43
-
44
-
45
-
46
-
47
-
48
-
49
-
50
-
51
-
52
-
53
-
54
-
55
-
56
-
57
-
58
-
59
-
60
-
61
-
62
-
63
-
64
-
65
-
66
-
67
-
68
-
69
-
70
-
71
-
72
-
73
-
74
-
75
-
76
 |
 |

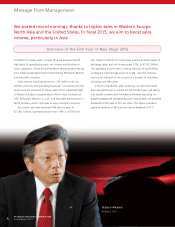
Fiscal 2014 Highlights
Sales volume (retail) increased by 43,000 units,
to 1.09 million units.
Operating income rose ¥12.5 billion, to ¥135.9 billion.
Net sales grew ¥87.3 billion year on year, to
¥2,180.7 billion.
Net income expanded ¥13.5 billion, to ¥118.2 billion.
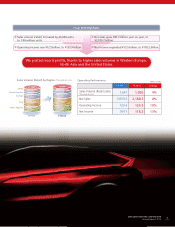
We posted record prots, thanks to higher sales volumes in Western Europe,
North Asia and the United States.
Japan
North America
Europe
Asia
Sales Volume (Retail) by Region (Thousands of units)
FY2013
202
261
1,047
143
97
344
FY2014
227
287
1,090
115
117
344
Other Regions
Operating Performance
FY2013 FY2014 Change
Sales Volume (Retail sales)
(Thousands of units) 1,047 1,090 4%
Net Sales 2,093.4 2,180.7 4%
Operating Income 123.4 135.9 10%
Net Income 104.7 118.2 13%
(Billions of yen)
MITSUBISHI MOTORS CORPORATION
Annual Report 2015 7