Mitsubishi 2015 Annual Report Download - page 12
Download and view the complete annual report
Please find page 12 of the 2015 Mitsubishi annual report below. You can navigate through the pages in the report by either clicking on the pages listed below, or by using the keyword search tool below to find specific information within the annual report.-
 1
1 -
 2
2 -
 3
3 -
 4
4 -
 5
5 -
 6
6 -
 7
7 -
 8
8 -
 9
9 -
 10
10 -
 11
11 -
 12
12 -
 13
13 -
 14
14 -
 15
15 -
 16
16 -
 17
17 -
 18
18 -
 19
19 -
 20
20 -
 21
21 -
 22
22 -
23
-
24
-
25
-
26
-
27
-
28
-
29
-
30
-
31
-
32
-
33
-
34
-
35
-
36
-
37
-
38
-
39
-
40
-
41
-
42
-
43
-
44
-
45
-
46
-
47
-
48
-
49
-
50
-
51
-
52
-
53
-
54
-
55
-
56
-
57
-
58
-
59
-
60
-
61
-
62
-
63
-
64
-
65
-
66
-
67
-
68
-
69
-
70
-
71
-
72
-
73
-
74
-
75
-
76
 |
 |

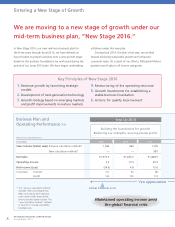
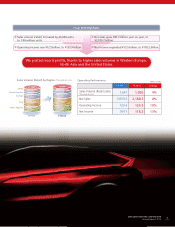
Operating Performance and Forecast
FY2013 (Actual) FY2014 (Actual) FY2015 (Forecast)
Sales Volume (Retail) 1,047 1,090 1,100
Net Sales 2,093.4 2,180.7 2,280.0
Operating Income 123.4 135.9 125.0
Operating Income Ratio
5.9% 6.2% 5.5%
Net Income* 104.7 118.2 100.0
Net Income Ratio 5.0% 5.4% 4.4%
In scal 2015, we expect to increase our sales volume in the
ASEAN region by 26,000 units against scal 2014 levels, buoyed
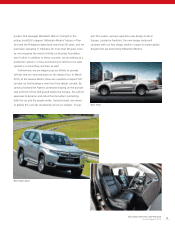
by the introduction of the new Pajero Sport and a full year of
sales of the new Triton, which we launched in scal 2014. We
also anticipate ongoing growth in overall demand in North Asia,
helping to augment sales volume for Asia as a whole by 34,000
units, or 10%, to 378,000 units. In Europe, we expect sales in
Russia to remain sluggish in scal 2015, due to the substantial
worsening of economic conditions in that country. In Western
Europe, on the other hand, we look forward to an increase led
by the introduction of the new Triton. For Europe as a whole,
we believe sales volume will fall year on year by 36,000 units,
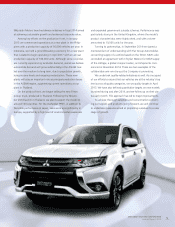
or 16%, to 191,000 units. In North America, in the rst half
we will launch the new Outlander, achieving a solid increase in
product competitiveness. Helped by these sales, we anticipate
sales volume in North America of 128,000 units, up 11,000
units, or 9%. We forecast a decline in overall demand in Japan
for scal 2015, resulting in a decline of 8,000 units, or 7%
from the scal 2014 gure, to 107,000 units. In other regions,
we look to a year-on-year increase of 9,000 units, or 3%, to
296,000 units. Summing up our forecasts for all regions, in s-
cal 2015 we expect sales volume to amount to 1.1 million units,
up 10,000 units, or 1%.
Based on these sales volume forecasts, for scal 2015 we
expect to generate net sales of ¥2,280.0 billion, operating
income of ¥125.0 billion and pro t attributable to owners of
parent of ¥100.0 billion.
2015
(Target)
2014
(Actual)
Japan
Regional Sales Volume (Retail)
(Thousands of units)
(FY)
(Thousands of units)
(FY)
(Thousands of units)
(FY)
(Thousands of units)
(FY)
Registered
Vehicles
Minicars
2015
(Target)
2014
(Actual)
North America
United
States
Canada &
Mexico
2015
(Target)
2014
(Actual)
Europe
Western
Europe &
Others
Russia &
others
2015
(Target)
2014
(Actual)
Asia
North Asia
ASEAN
(Thousands of units)
(FY) 2015
(Target)
2014
(Actual)
Regions
Australia
& NZ
Latin
America
Middle East
& Africa
115
75
40
68
39
117
82
35
128
91
37
227
73
154
191
31
160
344
128
216
378
242
136
287
79
107
101
296
113
101
82
107
Message from Management
Forecasts for Fiscal 2015
* “Profit attributable to owners of parent” in fiscal 2015.
(Billions of yen, thousands of units)
MITSUBISHI MOTORS CORPORATION
Annual Report 2015
10