Mitsubishi 2010 Annual Report Download - page 3
Download and view the complete annual report
Please find page 3 of the 2010 Mitsubishi annual report below. You can navigate through the pages in the report by either clicking on the pages listed below, or by using the keyword search tool below to find specific information within the annual report.-
 1
1 -
 2
2 -
 3
3 -
 4
4 -
 5
5 -
 6
6 -
 7
7 -
 8
8 -
 9
9 -
 10
10 -
 11
11 -
 12
12 -
 13
13 -
 14
14 -
15
-
16
-
17
-
18
-
19
-
20
-
21
-
22
-
23
-
24
-
25
-
26
-
27
-
28
-
29
-
30
-
31
-
32
-
33
-
34
-
35
-
36
-
37
-
38
-
39
-
40
-
41
-
42
-
43
-
44
-
45
-
46
-
47
-
48
-
49
-
50
-
51
-
52
-
53
-
54
-
55
-
56
-
57
-
58
-
59
-
60
-
61
-
62
-
63
-
64
-
65
-
66
-
67
-
68
-
69
-
70
-
71
-
72
 |
 |

0500
09
08
07
06
05
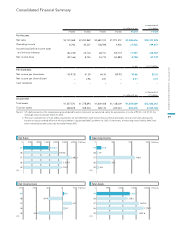
1,445.6
1,973.6
2,682.1
2,202.9
2,120.1
1,000 2,500 3,0001,500 2,000
–150 –100
09
08
07
06
05
4.8
–54.9
34.7
8.7
–92.2
50–50 0
050
09
08
07
06
05
13.9
3.9
108.6
40.2
6.8
100 150
0500
09
08
07
06
05
1,258.7
1,138.0
1,609.4
1,778.7
1,557.6
1,500
1,000 2,000
In millions of yen
In thousands of
U.S. dollars
FY2005 FY2006 FY2007 FY2008 FY2009 FY2009
For the year:
Net sales ¥2,120,068 ¥2,202,869 ¥2,682,103 ¥1,973,572 ¥1,445,616 $15,537,578
Operating income 6,783 40,237 108,596 3,926 13,920 149,617
Income (loss) before income taxes
and minority interests (82,745) 23,104 48,151 (53,717) 11,591 124,587
Net income (loss) (92,166) 8,745 34,710 (54,883) 4,758 51,139
In yen In U.S. dollars
Per share data:
Net income per share-basic ¥(19.75) ¥1.59 ¥6.30 ¥(9.91) ¥0.86 $0.01
Net income per share-diluted – 0.96 3.81 – 0.51 0.01
Cash dividends – – – – – –
In millions of yen
In thousands of
U.S. dollars
At year-end:
Total assets ¥1,557,570 ¥1,778,693 ¥1,609,408 ¥1,138,009 ¥1,258,669 $13,528,263
Total net assets 268,678 308,304 328,132 223,024 234,478 2,520,188
Notes: 1. U.S. dollar amounts in the accompanying consolidated financial statements are converted, solely for convenience, at a rate of 93.04 = U.S. $1.00, the
exchange rate prevailing on March 31, 2010.
2. The assets and liabilities of truck and bus operations are not reflected in each account because these operations were spun off and subsequently
became an equity method affiliate of Mitsubishi Motors Corporation (MMC) on March 14, 2003. Furthermore, all remaining shares held by MMC had
been transferred to other parties by the end of March 2005.
(FY)
(FY)
(FY)
(FY)
(¥ billion)
(¥ billion)
(¥ billion)
(¥ billion)
Consolidated Financial Summary
Net Sales
Net Income (Loss) Total Assets
Operating Income
01
MITSUBISHI MOTORS CORPORATION Annual Report 2010