Mitsubishi 2006 Annual Report Download - page 5
Download and view the complete annual report
Please find page 5 of the 2006 Mitsubishi annual report below. You can navigate through the pages in the report by either clicking on the pages listed below, or by using the keyword search tool below to find specific information within the annual report.-
 1
1 -
 2
2 -
 3
3 -
 4
4 -
 5
5 -
 6
6 -
 7
7 -
 8
8 -
 9
9 -
 10
10 -
 11
11 -
 12
12 -
 13
13 -
 14
14 -
 15
15 -
 16
16 -
17
-
18
-
19
-
20
-
21
-
22
-
23
-
24
-
25
-
26
-
27
-
28
-
29
-
30
-
31
-
32
-
33
-
34
-
35
-
36
-
37
-
38
-
39
-
40
-
41
-
42
-
43
-
44
-
45
-
46
-
47
-
48
-
49
-
50
-
51
-
52
-
53
-
54
-
55
-
56
-
57
-
58
-
59
-
60
-
61
-
62
-
63
-
64
-
65
-
66
-
67
-
68
-
69
-
70
-
71
-
72
-
73
-
74
-
75
-
76
-
77
-
78
-
79
-
80
-
81
-
82
-
83
-
84
-
85
-
86
-
87
-
88
-
89
-
90
-
91
-
92
 |
 |

3
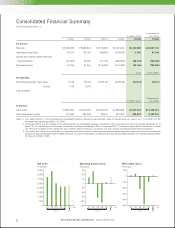
MITSUBISHI MOTORS CORPORATION ANNUAL REPORT 2006
0
500
1,000
1,500
2,000
2,500
3,000
0301 02 04 05 06
0
500
1,000
1,500
2,000
0301 02 04 05 06
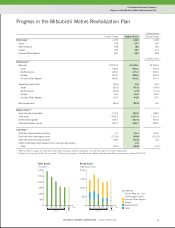
Total Assets
(¥ billion)
Retail Sales
(Thousand units)
쎱 OEM Plan
(Nissan Motor Co., Ltd.,
PSA Peugeot Citroën)
쎱Asia and Other Regions
쎱Europe
쎱North America
쎱Japan
Thousand units
FY2005 (Target) FY2005 (Actual) FY2006 (Target)
Retail Sales*11,370 1,344 1,408
Japan 256 257 302
North America 169 156 181
Europe 254 267 271
Asia and Other Regions 691 664 654
In billions of yen
Performance*1
Net sales ¥2,220.0 ¥2,120.1 ¥2,230.0
Japan 530.0 504.1 570.0
North America 430.0 415.7 450.0
Europe 620.0 586.2 600.0
Asia and Other Regions 640.0 614.1 610.0
Operating income (loss) (14.0) 6.8 43.0
Japan (62.0) (55.3) (24.0)
North America (22.0) (7.2) (11.0)
Europe 10.0 24.4 26.0
Asia and Other Regions 60.0 44.9 52.0
Net income (loss) (64.0) (92.2) 8.0
Balance Sheet*2
Cash and cash equivalents 175.0 259.0 168.0
Total assets 1,592.0 1,557.6 1,601.0
Interest-bearing debt 497.0 447.8 500.0
Total stockholders’ equity 281.0 268.7 289.0
Cash Flow*2
Cash flow from operating activities 1.0 54.4 105.0
Cash flow from investing activities (122.0) (84.8) (115.0)
Cash flow from financing activities 48.0 (19.0) 3.0
Effect of exchange rate changes on cash and cash equivalents – 2.6 –
Total (73.0) (46.8) (7.0)
*1MMC revised its targets for fiscal year 2005 and fiscal year 2006 on November 10, 2005 and April 27, 2006, respectively.
*2Targets for fiscal year 2005 and fiscal year 2006 are from figures in the Mitsubishi Motors Revitalization Plan announced on January 28, 2005.
Progress in the Mitsubishi Motors Revitalization Plan
Consolidated Financial Summary
Progress in the Mitsubishi Motors Revitalization Plan
(FY) (FY)
Actual Plan Actual Plan