Mitsubishi 2006 Annual Report Download - page 4
Download and view the complete annual report
Please find page 4 of the 2006 Mitsubishi annual report below. You can navigate through the pages in the report by either clicking on the pages listed below, or by using the keyword search tool below to find specific information within the annual report.-
 1
1 -
 2
2 -
 3
3 -
 4
4 -
 5
5 -
 6
6 -
 7
7 -
 8
8 -
 9
9 -
 10
10 -
 11
11 -
 12
12 -
 13
13 -
 14
14 -
 15
15 -
16
-
17
-
18
-
19
-
20
-
21
-
22
-
23
-
24
-
25
-
26
-
27
-
28
-
29
-
30
-
31
-
32
-
33
-
34
-
35
-
36
-
37
-
38
-
39
-
40
-
41
-
42
-
43
-
44
-
45
-
46
-
47
-
48
-
49
-
50
-
51
-
52
-
53
-
54
-
55
-
56
-
57
-
58
-
59
-
60
-
61
-
62
-
63
-
64
-
65
-
66
-
67
-
68
-
69
-
70
-
71
-
72
-
73
-
74
-
75
-
76
-
77
-
78
-
79
-
80
-
81
-
82
-
83
-
84
-
85
-
86
-
87
-
88
-
89
-
90
-
91
-
92
 |
 |

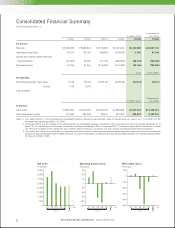
2MITSUBISHI MOTORS CORPORATION ANNUAL REPORT 2006
0
500
1,000
1,500
2,000
2,500
3,000
3,500
4,000
0301 02 04 05 06
-500
-400
-300
-200
-100
0
100
0301 02 04 05 06
-150
-120
-90
-60
-30
0
30
60
90
0301 02 04 05 06
Net Sales
(¥ billion)
Net Income (Loss)
(¥ billion)
Operating Income (Loss)
(¥ billion)
In thousands of
In millions of yen U.S. dollars
FY2001 FY2002 FY2003 FY2004 FY2005 FY2005
For the year:
Net sales ¥3,200,699 ¥3,884,874 ¥2,519,449 ¥2,122,626 ¥2,120,068 $18,047,741
Operating income (loss) 40,227 82,761 (96,852) (128,544) 6,783 57,748
Income (loss) before income taxes and
minority interest (31,875) 42,206 (77,173) (460,906) (82,745) (704,400)
Net income (loss) 11,256 37,361 (215,424) (474,785) (92,166) (784,596)
In yen In U.S. dollars
Per share data:
Net income (loss) per share: Basic ¥7.66 ¥25.35 ¥(145.22) ¥(194.36) ¥(19.75) $(0.17)
Diluted 7.42 23.43 – – – –
Cash dividends – – – – – –
In thousands of
In millions of yen U.S. dollars
At year-end:
Total assets ¥2,894,560 ¥2,425,352 ¥2,029,035 ¥1,589,286 ¥1,557,570 $13,259,301
Total stockholders’ equity 270,663 280,294 29,972 324,782 268,678 2,287,211
Notes: 1. U.S. dollar amounts in the accompanying consolidated financial statements are converted, solely for convenience, at a rate of ¥117.47=U.S.$1.00, the
exchange rate prevailing on March 31, 2006.
2. In the year 2003, due to a change of accounting period at consolidated overseas subsidiaries, with fiscal year-end date moving from December 31 to
March 31, 15-month figures for overseas subsidiaries have been incorporated. Prior to fiscal year 2001, the accounting periods of subsidiaries in Japan
ran from April to March of the subsequent year, whereas those of overseas subsidiaries ran from January to December with certain exceptions.
3. The assets and liabilities of truck and bus operations are not reflected in each account because these operations were spun off and subsequently
became an equity-method affiliate of MMC on March 14, 2003. Furthermore, all remaining shares held by MMC had been transferred to other parties
by the end of March 2005.
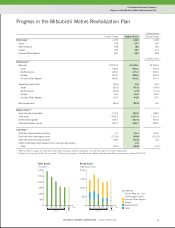
Consolidated Financial Summary
For the years ended March 31,
(FY)
Actual
(FY) (FY)
Plan Actual Plan Actual Plan