Mercury Insurance 2008 Annual Report Download - page 8
Download and view the complete annual report
Please find page 8 of the 2008 Mercury Insurance annual report below. You can navigate through the pages in the report by either clicking on the pages listed below, or by using the keyword search tool below to find specific information within the annual report.-
 1
1 -
 2
2 -
 3
3 -
 4
4 -
 5
5 -
 6
6 -
 7
7 -
 8
8 -
 9
9 -
 10
10 -
 11
11 -
 12
12 -
 13
13 -
 14
14 -
 15
15 -
 16
16 -
 17
17 -
 18
18 -
 19
19 -
20
-
21
-
22
-
23
-
24
-
25
-
26
-
27
-
28
-
29
-
30
-
31
-
32
-
33
-
34
-
35
-
36
-
37
-
38
-
39
-
40
-
41
-
42
-
43
-
44
-
45
-
46
-
47
-
48
-
49
-
50
-
51
-
52
-
53
-
54
-
55
-
56
-
57
-
58
-
59
-
60
-
61
-
62
-
63
-
64
-
65
-
66
-
67
-
68
-
69
-
70
-
71
-
72
-
73
-
74
-
75
-
76
-
77
-
78
-
79
-
80
-
81
-
82
-
83
-
84
-
85
-
86
-
87
-
88
-
89
-
90
-
91
-
92
-
93
-
94
-
95
-
96
-
97
-
98
-
99
-
100
-
101
-
102
-
103
-
104
-
105
-
106
 |
 |

6
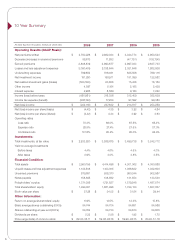
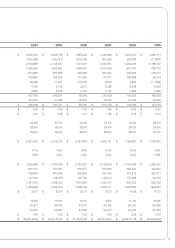
10 Year Summary
All dollar figures in thousands, except per share data 2008 2007 2006 2005
Operating Results (GAAP Basis):
Net premiums written $ 2,750,226 $2,982,024 $ 3,044,774 $ 2,950,523
Decrease (increase) in unearned premiums 58,613 11,85 3 (47,751) (102,790)
Earned premiums 2,808,839 2,993,877 2,997,023 2,847,733
Losses and loss adjustment expenses 2,060,409 2,036,644 2,021,646 1,862,936
Underwriting expenses 799,682 818,481 825,508 769,116
Net investment income 151,280 15 8,911 151,099 122,582
Net realized investment gains (losses) (550,520) 20,808 15,436 16,160
Other income 4,597 5,15 4 5,185 5,438
Interest expense 4,966 8,589 9,180 7,222
Income (loss) before taxes (450,861) 315,036 312,409 352,639
Income tax expense (benefit) ( 20 8,742 ) 77,204 97,592 99,380
Net (loss) income $ ( 242,119 ) $2 37, 8 3 2 $ 214,817 $ 253,259
Net (loss) income per share (basic) $ (4.42) $4.35 $ 3.93 $ 4.64
Net (loss) income per share (diluted) $ (4.42) $4.34 $ 3.92 $ 4.63
Operating ratios
Loss ratio 73.3% 68.0% 67.5% 65.4%
Expense ratio 28.5% 27.4 % 27.5% 27.0%
Combined ratio 101.8% 95.4% 95.0% 92.4%
Investments:
Total investments, at fair value $ 2,933,820 $3,588,675 $ 3,499,738 $ 3,242,712
Yield on average investments
Before taxes 4.4% 4.6% 4.5% 4.0%
After taxes 3.9% 4.0% 3.8% 3.5%
Financial Condition:
Total assets $ 3,950,195 $ 4,414,496 $ 4,301,062 $ 4,050,868
Unpaid losses and loss adjustment expenses 1,13 3,50 8 1,103,915 1,088,822 1,022,603
Unearned premiums 879,651 938,370 950,344 902,567
Notes payable 158,625 138,562 141,554 143,540
Policyholders’ surplus 1,371,095 1,721,827 1,579,248 1,487,574
Total shareholders’ equity 1,494,051 1,861,998 1,724,130 1,607,837
Book value per share $ 27. 2 8 $34.02 $ 31.54 $ 29.44
Other Information:
Return on average shareholders’ equity 6.9% 12.5% 12.3% 15.8%
Basic average shares outstanding (000’s) 54,74 4 54,704 54,651 54,566
Shares outstanding at year-end (000’s) 54,764 54,730 54,670 54,605
Dividends per share $ 2.32 $2.08 $ 1.92 $ 1.72
Price range (bids) of common stock $ 6 2. 0 0 -3 6.11 $59.06-48.76 $ 59.90-48.75 $ 60.45-51.16