Mercury Insurance 2008 Annual Report Download - page 19
Download and view the complete annual report
Please find page 19 of the 2008 Mercury Insurance annual report below. You can navigate through the pages in the report by either clicking on the pages listed below, or by using the keyword search tool below to find specific information within the annual report.-
 1
1 -
2
-
3
-
4
-
5
-
6
-
7
-
8
-
 9
9 -
 10
10 -
 11
11 -
 12
12 -
 13
13 -
 14
14 -
 15
15 -
 16
16 -
 17
17 -
 18
18 -
 19
19 -
 20
20 -
 21
21 -
 22
22 -
 23
23 -
 24
24 -
 25
25 -
 26
26 -
 27
27 -
 28
28 -
 29
29 -
30
-
31
-
32
-
33
-
34
-
35
-
36
-
37
-
38
-
39
-
40
-
41
-
42
-
43
-
44
-
45
-
46
-
47
-
48
-
49
-
50
-
51
-
52
-
53
-
54
-
55
-
56
-
57
-
58
-
59
-
60
-
61
-
62
-
63
-
64
-
65
-
66
-
67
-
68
-
69
-
70
-
71
-
72
-
73
-
74
-
75
-
76
-
77
-
78
-
79
-
80
-
81
-
82
-
83
-
84
-
85
-
86
-
87
-
88
-
89
-
90
-
91
-
92
-
93
-
94
-
95
-
96
-
97
-
98
-
99
-
100
-
101
-
102
-
103
-
104
-
105
-
106
 |
 |

9
Equity holdings consist of perpetual preferred stocks and dividend-bearing common stocks on which dividend income is
partially tax-sheltered by the 70% corporate dividend exclusion. At year end, short-term investments consisted of highly rated
short-duration securities redeemable on a daily or weekly basis. The Company does not have any material direct equity investment
in subprime lenders.
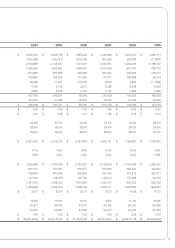
Investment Results
The following table summarizes the investment results of the Company for the most recent five years:
2008 2007 2006 2005 2004
Average invested assets (includes short-term
investments) (1) 3,452,803$ 3,468,399$ 3,325,435$ 3,058,110$ 2,662,224$
Net investment income:
Before income taxes 151,280$ 158,911$ 151,099$ 122,582$ 109,681$
After income taxes 133,721$ 137,777$ 127,741$ 105,724$ 95,897$
Average annual yield on investments:
Before income taxes 4.4% 4.6% 4.5% 4.0% 4.1%
After income taxes 3.9% 4.0% 3.8% 3.5% 3.6%
Net realized investment (losses) gains after
income taxes (2) (357,838)$ 13,525$ 10,033$ 10,504$ 16,292$
Net increase (decrease) in unrealized gains/
losses on investments after income
taxes (3) -$ 10,905$ 3,103$ (14,000)$ (4,284)$
Year ended December 31,
(Amounts in thousands)
(1) Fixed maturities at amortized cost, and equities and short-term investments at cost before write-downs.
(2) Includes investment impairment write-down, net of tax benefit, of $14.7 million in 2007, $1.3 million in 2006, $1.4 million
in 2005 and $0.6 million in 2004. 2007 also includes $1.3 million gain, net of tax, and $0.9 million loss, net of tax benefit,
related to the change in the fair value of trading securities and hybrid financial instruments, respectively.
(3) Effective January 1, 2008, the Company adopted SFAS No. 159. The losses and gains due to changes in fair value for items
measured at fair value pursuant to election of the fair value option were included in net realized investment losses and gains.
Competitive Conditions
The property and casualty insurance industry is highly competitive and consists of a large number of multi-state
competitors offering automobile, homeowners, commercial property insurance, and other lines. Many of the Company’s
competitors have larger volumes of business and greater financial resources than those of the Company. Based on the most recent
regularly published statistical compilations of premiums written in 2007, the Company was the third largest writer of private
passenger automobile insurance in California and the fourteenth largest in the United States. Competitors with greater market
share in California sell insurance through exclusive agents, rather than through independent agents and brokers.
The property and casualty insurance industry is highly cyclical, characterized by periods of high premium rates and
shortages of underwriting capacity (“hard market”) followed by periods of severe price competition and excess capacity (“soft
market”). In management’s view, 2004 through 2007 was a period of very profitable results for companies underwriting
automobile insurance. Many in the industry began experiencing declining profitability in 2007 and 2008.
Reputation for service and price are the principal means by which the Company competes with other automobile
insurers. The Company believes that it has a good reputation for service, and it has historically been among the lowest-priced
insurers doing business in California according to surveys conducted by the California DOI. In addition, the marketing efforts of
independent agents and brokers can also provide a competitive advantage.
All rates charged by private passenger automobile insurers in California are subject to the prior approval of the California
DOI. See “Regulation—Department of Insurance Oversight.”
The Company encounters similar competition in each state outside California and line of business in which it operates.