Mercury Insurance 2008 Annual Report Download - page 3
Download and view the complete annual report
Please find page 3 of the 2008 Mercury Insurance annual report below. You can navigate through the pages in the report by either clicking on the pages listed below, or by using the keyword search tool below to find specific information within the annual report.-
 1
1 -
 2
2 -
 3
3 -
 4
4 -
 5
5 -
 6
6 -
 7
7 -
 8
8 -
 9
9 -
 10
10 -
 11
11 -
 12
12 -
 13
13 -
 14
14 -
15
-
16
-
17
-
18
-
19
-
20
-
21
-
22
-
23
-
24
-
25
-
26
-
27
-
28
-
29
-
30
-
31
-
32
-
33
-
34
-
35
-
36
-
37
-
38
-
39
-
40
-
41
-
42
-
43
-
44
-
45
-
46
-
47
-
48
-
49
-
50
-
51
-
52
-
53
-
54
-
55
-
56
-
57
-
58
-
59
-
60
-
61
-
62
-
63
-
64
-
65
-
66
-
67
-
68
-
69
-
70
-
71
-
72
-
73
-
74
-
75
-
76
-
77
-
78
-
79
-
80
-
81
-
82
-
83
-
84
-
85
-
86
-
87
-
88
-
89
-
90
-
91
-
92
-
93
-
94
-
95
-
96
-
97
-
98
-
99
-
100
-
101
-
102
-
103
-
104
-
105
-
106
 |
 |

Even as we embark on a new year and make our
way into 2009, there is no denying the far-reaching
implications of the severe economic decline. It has
impacted virtually every type of company, in every
industry, across every region of the country, and we
are no exception. Although the insurance industry is
somewhat less vulnerable during a recession, we
are not immune to the unique challenges of the cur-
rent environment. The rapid decline of the equity
and debt markets during the latter half of 2008 sig-
nificantly impacted our investment portfolio. In addi-
tion, increasing job losses, deteriorating credit mar-
kets and the lack of consumer confidence all affect
our business as well. Although we may face addi-
tional challenges in the months ahead before things
get better, history has taught us they will get better,
and we are positioning the Company to be ready
when the market improves.
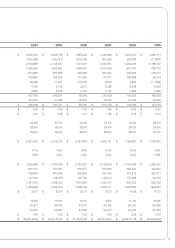
Turning to our Statement of Operations for 2008,
the Company posted a net loss of $242 million, or
$4.42 per share, in 2008. The net loss was due, pri-
marily, to declines in the value
of our investment portfolio that
resulted from the extreme dis-
ruption in the capital markets
during the second half of the
year. As a result of implement-
ing Statement of Financial
Accounting Standards No.
159 (“SFAS No. 159”) in 2008,
the total realized investment
loss of $551 million included
$526 million of losses on investments that the
Company still holds. Approximately half that amount
comes from bonds, which we generally intend to
hold until they recover their value at maturity.
Operating earnings, which exclude actual realized
gains and losses from the sale of securities and the
impact of SFAS No. 159, were $116 million, or $2.12
per share, for 2008, compared to $4.09 per share for
2007. This year over year reduction was primarily due
to an increase in our combined ratio, which I discuss
in further detail below.
The competitive environment for personal automo-
bile insurance remained intense during 2008.
Favorable underwriting results for the industry over
the past several years has extended the duration of
the soft market. One of the primary drivers of this
trend has been lower loss frequency. However, we
believe increases in claim severity will more than off-
set the reduction in frequency going forward.
Consequently, we continue to expect rate increase
filings to outpace rate decrease filings during 2009,
continuing a trend we began to observe in late 2008.
Nevertheless, significant marketing expenditures and
increased agent incentives by many of our competi-
tors made 2008 a very difficult environment in which
to grow.
As a result, Company-wide premiums written
declined from 2007 by 7.8% to $2.8 billion in 2008.
In California, premiums written declined by 6.2% for
the year to $2.2 billion, while our non-California oper-
ations premiums written declined by 13.1% to $589
million. As I discuss in more detail later in this letter,
we have many initiatives throughout the Company to
increase our premium volume. However, as we look
ahead, we anticipate 2009 to be another challenging
year, with expected declines in premium growth
somewhere in the range of mid-single digits.
As I referenced earlier, we experienced a
Company-wide deterioration in our combined ratio,
which increased to 101.8% in 2008, compared with
95.4% in 2007. In California, our combined ratio
increased from 92.6% in 2007 to 98.0% in 2008,
reflecting higher severity in our auto line, partially off-
set by a reduction in frequency. In addition, we saw
To Our Shareholders:
Although the insurance
industry is somewhat
less vulnerable during a
recession, we are not
immune from the unique
challenges of the
current environment.
1