Mercury Insurance 2008 Annual Report Download - page 6
Download and view the complete annual report
Please find page 6 of the 2008 Mercury Insurance annual report below. You can navigate through the pages in the report by either clicking on the pages listed below, or by using the keyword search tool below to find specific information within the annual report.-
 1
1 -
 2
2 -
 3
3 -
 4
4 -
 5
5 -
 6
6 -
 7
7 -
 8
8 -
 9
9 -
 10
10 -
 11
11 -
 12
12 -
 13
13 -
 14
14 -
 15
15 -
 16
16 -
 17
17 -
18
-
19
-
20
-
21
-
22
-
23
-
24
-
25
-
26
-
27
-
28
-
29
-
30
-
31
-
32
-
33
-
34
-
35
-
36
-
37
-
38
-
39
-
40
-
41
-
42
-
43
-
44
-
45
-
46
-
47
-
48
-
49
-
50
-
51
-
52
-
53
-
54
-
55
-
56
-
57
-
58
-
59
-
60
-
61
-
62
-
63
-
64
-
65
-
66
-
67
-
68
-
69
-
70
-
71
-
72
-
73
-
74
-
75
-
76
-
77
-
78
-
79
-
80
-
81
-
82
-
83
-
84
-
85
-
86
-
87
-
88
-
89
-
90
-
91
-
92
-
93
-
94
-
95
-
96
-
97
-
98
-
99
-
100
-
101
-
102
-
103
-
104
-
105
-
106
 |
 |

4
2.5
2.0
1.5
1.0
0
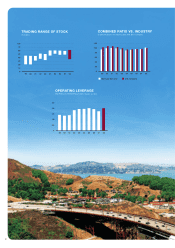
OPERATING LEVERAGE
(Net Premiums Written/Policyholders Surplus as ratio)
99 00 01 02 03 04 05 06 07 08
0.5
120
100
80
60
40
20
0
COMBINED RATIO VS. INDUSTRY
(in percent) Source for industry data: A.M. Best Company
99
Mercury General U.S. Industry
00 01 02 03 04 05 06 07 08
120
70
50
40
30
20
0
TRADING RANGE OF STOCK
(in dollars)
99 00 01 02 03 04 05 06 07 08
60
10