Mercury Insurance 2008 Annual Report Download - page 18
Download and view the complete annual report
Please find page 18 of the 2008 Mercury Insurance annual report below. You can navigate through the pages in the report by either clicking on the pages listed below, or by using the keyword search tool below to find specific information within the annual report.-
 1
1 -
2
-
3
-
4
-
5
-
6
-
7
-
 8
8 -
 9
9 -
 10
10 -
 11
11 -
 12
12 -
 13
13 -
 14
14 -
 15
15 -
 16
16 -
 17
17 -
 18
18 -
 19
19 -
 20
20 -
 21
21 -
 22
22 -
 23
23 -
 24
24 -
 25
25 -
 26
26 -
 27
27 -
 28
28 -
29
-
30
-
31
-
32
-
33
-
34
-
35
-
36
-
37
-
38
-
39
-
40
-
41
-
42
-
43
-
44
-
45
-
46
-
47
-
48
-
49
-
50
-
51
-
52
-
53
-
54
-
55
-
56
-
57
-
58
-
59
-
60
-
61
-
62
-
63
-
64
-
65
-
66
-
67
-
68
-
69
-
70
-
71
-
72
-
73
-
74
-
75
-
76
-
77
-
78
-
79
-
80
-
81
-
82
-
83
-
84
-
85
-
86
-
87
-
88
-
89
-
90
-
91
-
92
-
93
-
94
-
95
-
96
-
97
-
98
-
99
-
100
-
101
-
102
-
103
-
104
-
105
-
106
 |
 |

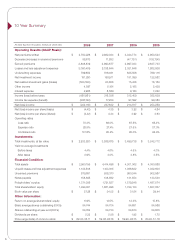
8
Investments and Investment Results
General
The Company’s investments are directed by the Company’s Chief Investment Officer under the supervision of the
Company’s Board of Directors. The Company follows an investment policy that is regularly reviewed and revised. The
Company’s policy emphasizes investment grade, fixed income securities and maximization of after-tax yields and places certain
restrictions to limit portfolio concentrations and market exposure. Sales of securities are undertaken, with resulting gains or
losses, in order to enhance after-tax yield and keep the portfolio in line with current market conditions. Tax considerations,
including the impact of the alternative minimum tax (“AMT”), are important in portfolio management. Changes in loss
experience, growth rates and profitability produce significant changes in the Company’s exposure to AMT liability, requiring
appropriate shifts in the investment asset mix between taxable bonds, tax-exempt bonds and equities in order to maximize after-
tax yield. The Company closely monitors the timing and recognition of capital gains and losses to maximize the realization of any
deferred tax assets arising from capital losses. At December 31, 2008, the Company had available tax gains carried forward of
approximately $43 million.
Investment Portfolio
The following table sets forth the composition of the Company’s investment portfolio:
Amortized Cost Fair Value Amortized Cost Fair Value Amortized Cost Fair Value
Taxable bonds 313,218$ 286,441$ 440,028$ 437,838$ 583,602$ 577,575$
Tax-exempt state and municipal bonds 2,360,874 2,179,178 2,418,348 2,447,851 2,264,321 2,317,646
Redeemable fund preferred stocks 54,379 16,054 2,079 2,071 3,792 3,766
Total fixed maturities 2,728,471 2,481,673 2,860,455 2,887,760 2,851,715 2,898,987
Equity investments including
non-redeemable preferred stocks 403,773 247,391 330,995 428,237 258,310 318,449
Short-term investments 208,278 204,756 272,678 272,678 282,302 282,302
Total investments 3,340,522$ 2,933,820$ 3,464,128$ 3,588,675$ 3,392,327$ 3,499,738$
(Amounts in thousands)
December 31,
2006
20072008
The Company continually evaluates the recoverability of its investment holdings. Prior to the adoption of Statement of
Financial Accounting Standard (“SFAS”) No. 159, “The Fair Value Option for Financial Assets and Financial Liabilities -
Including an Amendment of Financial Accounting Standards Board (“FASB”) Statement No. 115” (“SFAS No. 159”), when a
decline in value of fixed maturities or equity securities was considered other than temporary, the Company wrote the security
down to fair value by recognizing a loss in the consolidated statement of operations. Declines in value considered to be temporary
were charged as unrealized losses to shareholders’ equity as a reduction of accumulated other comprehensive income. See “Item
7. Management’s Discussion and Analysis of Financial Condition and Results of Operations—Liquidity and Capital Resources”
and Note 2 of Notes to Consolidated Financial Statements.
At December 31, 2008, approximately 74% of the Company’s total investment portfolio at fair value and 88% of its total
fixed maturity investments at fair value were invested in tax-exempt municipal bonds. Shorter duration sinking fund preferred
stocks and collateralized mortgage obligations together represented 7.5% of the Company’s total investment portfolio at fair
value. The weighted average Standard & Poor’s, Moody’s and Fitch’s rating of the Company’s bond holdings was AA at
December 31, 2008. Holdings of lower than investment grade bonds and non rated bonds constituted approximately 1.9% and
1.7%, respectively, of total invested assets at fair value.
The nominal average maturity of the overall bond portfolio, including collateralized mortgage obligations and short-term
investments, was 13.9 years at December 31, 2008, which reflects a portfolio heavily weighted in investment grade tax-exempt
municipal bonds. The call-adjusted average maturity of the overall bond portfolio was approximately 10.8 years, related to
holdings which are heavily weighted with high coupon issues that are expected to be called prior to maturity. The modified
duration of the overall bond portfolio reflecting anticipated early calls was 7.2 years at December 31, 2008, including
collateralized mortgage obligations with modified durations of approximately 1.7 years and short-term investments that carry no
duration. Modified duration measures the length of time it takes, on average, to receive the present value of all the cash flows
produced by a bond, including reinvestment of interest. Because it measures four factors (maturity, coupon rate, yield and call
terms), which determine sensitivity to changes in interest rates, modified duration is considered a better indicator of price
volatility than simple maturity alone. The longer the duration, the greater the price volatility in relation to changes in interest
rates.