Mattel 1999 Annual Report Download - page 11
Download and view the complete annual report
Please find page 11 of the 1999 Mattel annual report below. You can navigate through the pages in the report by either clicking on the pages listed below, or by using the keyword search tool below to find specific information within the annual report.-
 1
1 -
 2
2 -
 3
3 -
 4
4 -
 5
5 -
 6
6 -
 7
7 -
 8
8 -
 9
9 -
 10
10 -
 11
11 -
 12
12 -
 13
13 -
 14
14 -
 15
15 -
 16
16 -
 17
17 -
 18
18 -
 19
19 -
 20
20 -
 21
21 -
 22
22 -
23
-
24
-
25
-
26
-
27
-
28
-
29
-
30
-
31
-
32
-
33
-
34
-
35
-
36
-
37
-
38
-
39
-
40
-
41
-
42
-
43
-
44
-
45
-
46
-
47
-
48
 |
 |

9
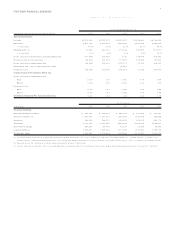
FIVE-YEAR FINANCIAL SUMMARY
Mattel, Inc. and Subsidiaries
For the Year Ended December 3 1 ( a)
( In thousands, except per share and percentage information) 199 9 199 8 199 7 199 6 199 5
Operating Results:
Net sales $5 ,51 4,95 0 $5 ,62 1,20 7 $5 ,45 5,54 7 $5 ,06 4,86 0 $4 ,70 8,45 2
Gross profit 2,6 01 ,0 40 2,9 13 ,3 03 2,8 19 ,6 60 2,5 90 ,0 78 2,2 92 ,3 09
% of net sales 47 .2% 51 .8% 51 .7% 51 .1% 48 .7%
Operating profit ( b) 40 ,86 6 52 0,1 00 1 13 ,82 8 31 5,8 27 61 4,5 41
% of net sales 0.7 % 9.3 % 2.1 % 6.2 % 13 .1 %
Income ( loss) before income taxes and extraordinary item ( 11 0,7 43 ) 39 1,6 32 1,2 16 1 88 ,89 8 50 6,2 43
( Benefit) provision for income taxes ( 28 ,37 0) 18 5,5 79 1 79 ,32 7 16 6,9 36 1 97 ,24 6
Income ( loss) before extraordinary item ( 82 ,37 3) 20 6,0 53 ( 17 8,1 11 ) 21 ,96 2 30 8,9 97
Extraordinary item - loss on early retirement of debt – – (4,6 10 ) – –
Net income ( loss) ( 82 ,37 3) 20 6,0 53 ( 18 2,7 21 ) 21 ,96 2 30 8,9 97
Income (Loss) Per Common Share (c):
Income ( loss) before extraordinary item
Basic ( 0 .2 1 ) 0 .5 1 ( 0 .5 1 ) 0.0 4 0 .8 8
Diluted ( 0 .2 1 ) 0 .4 7 ( 0 .5 1 ) 0.0 4 0 .8 6
Net income ( loss)
Basic ( 0 .2 1 ) 0 .5 1 ( 0 .5 2 ) 0.0 4 0 .8 8
Diluted ( 0 .2 1 ) 0 .4 7 ( 0 .5 2 ) 0.0 4 0 .8 6
Dividends Declared Per Common Share (c) 0.3 5 0 .31 0 .27 0 .2 4 0.19
As of Year End ( a)
( In thousands) 199 9 199 8 199 7 199 6 199 5
Financial Position:
Cash and marketable securities $ 275,02 4 $ 46 9,21 3 $ 8 83 ,90 3 $ 811,28 4 $ 71 5,4 40
Accounts receivable, net 1,2 70 ,0 05 1,1 50 ,0 51 1,2 53 ,3 43 1,0 33 ,0 66 92 6,62 6
Inventories 54 4,2 96 6 44 ,2 70 4 68 ,22 6 46 3,2 12 4 29 ,1 10
Total assets 5,1 27 ,0 22 5,1 47 ,3 85 4,5 12 ,8 43 4,6 07 ,0 08 4,3 94 ,8 01
Short-term borrowings 36 9,5 49 1 99 ,00 6 52 ,61 8 53 ,92 4 76 ,44 3
Long-term liabilities 1,3 46 ,8 11 1,3 33 ,5 48 1,1 10 ,7 22 1,1 21 ,3 50 1,2 66 ,0 79
Stockholders’ equity 1,9 62 ,6 87 2,1 70 ,8 03 1,9 33 ,3 38 2,1 09 ,7 87 1,8 97 ,1 76
( a) Consolidated financial information for all periods presented has been restated retroactively for the effects of the May 199 9 merger with The Learning Company, Inc. ( “ Learning Company” ), accounted for as a
pooling of interests. Consolidated financial information for 1 9 9 5-199 7 has been restated retroactively for the effects of the March 1 99 7 merger with Tyco Toys, Inc. ( “ Tyco” ), accounted for as a pooling of interests.
( b) Represents income from operations before interest expense and ( benefit) provision for income taxes.
( c) Per share data reflect the retroactive effect of stock splits distributed to stockholders in March 1 99 6 and January 1 9 95 , and the mergers w ith Learning Company and Tyco in 1 99 9 and 19 97, respectively.