Marks and Spencer 2007 Annual Report Download - page 4
Download and view the complete annual report
Please find page 4 of the 2007 Marks and Spencer annual report below. You can navigate through the pages in the report by either clicking on the pages listed below, or by using the keyword search tool below to find specific information within the annual report.-
 1
1 -
 2
2 -
 3
3 -
 4
4 -
 5
5 -
 6
6 -
 7
7 -
 8
8 -
 9
9 -
 10
10 -
 11
11 -
 12
12 -
 13
13 -
 14
14 -
 15
15 -
16
-
17
-
18
-
19
-
20
-
21
-
22
-
23
-
24
-
25
-
26
-
27
-
28
-
29
-
30
-
31
-
32
-
33
-
34
-
35
-
36
-
37
-
38
-
39
-
40
-
41
-
42
-
43
-
44
-
45
-
46
-
47
-
48
-
49
-
50
-
51
-
52
-
53
-
54
-
55
-
56
-
57
-
58
-
59
-
60
-
61
-
62
-
63
-
64
-
65
-
66
-
67
-
68
-
69
-
70
-
71
-
72
-
73
-
74
-
75
-
76
-
77
-
78
-
79
-
80
-
81
-
82
-
83
-
84
-
85
-
86
-
87
-
88
-
89
-
90
-
91
-
92
-
93
-
94
-
95
-
96
-
97
-
98
-
99
-
100
-
101
-
102
-
103
-
104
 |
 |

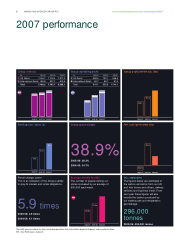
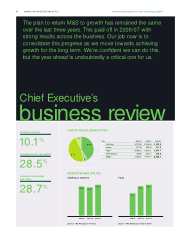
Group revenue
£m 2004/05 2005/06 2006/07
■UK Retail 7,034.7 7,275.0 7,977.5
■International Retail 455.8 522.7 610.6
Total 7,490.5 7,797.7 8,588.1
Earnings per share (p)
Average weekly footfall
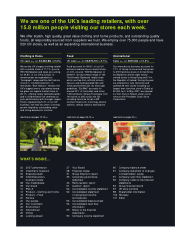
The number of people visiting our
stores increased by an average of
500,000 each week.
Group operating profit
£m 2004/05 2005/06 2006/07
■UK Retail 588.4 790.1 956.5
■International Retail 60.7 65.7 87.5
Total 649.1 855.8 1,044.0
Net cash generated (£m)
CO2emissions
The figures below are estimates of
the carbon emissions from our UK
and Irish stores and offices, delivery
vehicles and business travel. From
next year these figures will also
include the carbon produced by
our warehouses and refrigeration
gas leakage.
296,000
tonnes
2005/06: 404,000 tonnes
Group profit before tax (£m)
Group gross margin
38.9%
2005/06: 38.3%
2004/05: 34.7%
Fixed charge cover
This is an indication of the Group’s ability
to pay its interest and rental obligations.
5.9 times
2005/06: 4.9 times
2004/05: 4.1 times
2MARKS AND SPENCER GROUP PLC www.marksandspencer.com/annualreport2007
2007 performance
2004/05 2005/06 2006/07
2004/05 2005/06 2006/07
19.2
31.4
40.4
2004/05 2005/06 2006/07
15.3m
14.9m
15.8m
2004/05 2005/06 2006/07
(104.5)
550.5
231.1
2004/05 2005/06 2006/07
2004/05 2005/06 2006/07
556.1
751.4
965.2
The profit measures above are from continuing operations and stated before property disposals and exceptional items.
KPI = Key Performance Indicator