LinkedIn 2014 Annual Report Download - page 120
Download and view the complete annual report
Please find page 120 of the 2014 LinkedIn annual report below. You can navigate through the pages in the report by either clicking on the pages listed below, or by using the keyword search tool below to find specific information within the annual report.-
 1
1 -
2
-
3
-
4
-
5
-
6
-
7
-
8
-
9
-
10
-
11
-
12
-
13
-
14
-
15
-
16
-
17
-
18
-
19
-
20
-
21
-
22
-
23
-
24
-
25
-
26
-
27
-
28
-
29
-
30
-
31
-
32
-
33
-
34
-
35
-
36
-
37
-
38
-
39
-
40
-
41
-
42
-
43
-
44
-
45
-
46
-
47
-
48
-
49
-
50
-
51
-
52
-
53
-
54
-
55
-
56
-
57
-
58
-
59
-
60
-
61
-
62
-
63
-
64
-
65
-
66
-
67
-
68
-
69
-
70
-
71
-
72
-
73
-
74
-
75
-
76
-
77
-
78
-
79
-
80
-
81
-
82
-
83
-
84
-
85
-
86
-
87
-
88
-
89
-
90
-
91
-
92
-
93
-
94
-
95
-
96
-
97
-
98
-
99
-
100
-
101
-
102
-
103
-
104
-
105
-
106
-
107
-
108
-
109
-
 110
110 -
 111
111 -
 112
112 -
 113
113 -
 114
114 -
 115
115 -
 116
116 -
 117
117 -
 118
118 -
 119
119 -
 120
120 -
 121
121 -
 122
122 -
 123
123 -
 124
124 -
 125
125 -
 126
126 -
 127
127 -
 128
128 -
 129
129 -
 130
130 -
131
 |
 |

reinvested offshore indefinitely. The income tax liability would be insignificant if these earnings were to
be repatriated.
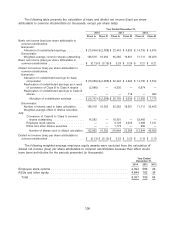
14. Information About Revenue and Geographic Areas
The Company considers operating segments to be components of the Company in which separate
financial information is available that is evaluated regularly by the Company’s chief operating decision
maker in deciding how to allocate resources and in assessing performance. The chief operating
decision maker for the Company is the Chief Executive Officer (‘‘CEO’’). The CEO reviews financial
information presented on a consolidated basis, accompanied by information about revenue by product,
sales channel, and geographic region for purposes of allocating resources and evaluating financial
performance. Accordingly, the Company has determined that it has one operating segment, and
therefore, one reportable segment.
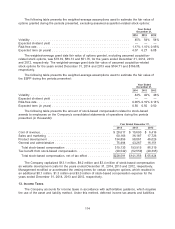
In the second quarter of 2014, recruitment media products were reclassified from Marketing
Solutions to Talent Solutions as they are generally sold to Talent Solutions customers. Accordingly,
prior period amounts have been recast to conform to the current period presentation. Recruitment
media revenue in 2014, 2013 and 2012 was $72.2 million, $50.6 million and $23.0 million, respectively.
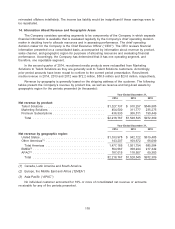
Revenue by geography is generally based on the shipping address of the customer. The following
tables present the Company’s revenue by product line, as well as revenue and long-lived assets by
geographic region for the periods presented (in thousands):
Year Ended December 31,
2014 2013 2012
Net revenue by product:
Talent Solutions ................................. $1,327,737 $ 910,257 $546,585
Marketing Solutions .............................. 454,500 311,777 235,275
Premium Subscriptions ............................ 436,530 306,511 190,449
Total ....................................... $2,218,767 $1,528,545 $972,309
Year Ended December 31,
2014 2013 2012
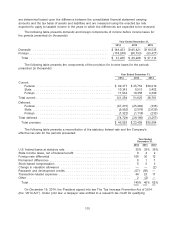
Net revenue by geographic region:
United States ................................... $1,333,978 $ 942,122 $619,485
Other Americas(1) ................................ 143,207 109,672 66,099
Total Americas ................................ 1,477,185 1,051,794 685,584
EMEA(2) ....................................... 554,567 358,244 217,342
APAC(3) ....................................... 187,015 118,507 69,383
Total ....................................... $2,218,767 $1,528,545 $972,309
(1) Canada, Latin America and South America
(2) Europe, the Middle East and Africa (‘‘EMEA’’)
(3) Asia-Pacific (‘‘APAC’’)
No individual customer accounted for 10% or more of consolidated net revenue or accounts
receivable for any of the periods presented.
118