LinkedIn 2014 Annual Report Download - page 114
Download and view the complete annual report
Please find page 114 of the 2014 LinkedIn annual report below. You can navigate through the pages in the report by either clicking on the pages listed below, or by using the keyword search tool below to find specific information within the annual report.-
 1
1 -
2
-
3
-
4
-
5
-
6
-
7
-
8
-
9
-
10
-
11
-
12
-
13
-
14
-
15
-
16
-
17
-
18
-
19
-
20
-
21
-
22
-
23
-
24
-
25
-
26
-
27
-
28
-
29
-
30
-
31
-
32
-
33
-
34
-
35
-
36
-
37
-
38
-
39
-
40
-
41
-
42
-
43
-
44
-
45
-
46
-
47
-
48
-
49
-
50
-
51
-
52
-
53
-
54
-
55
-
56
-
57
-
58
-
59
-
60
-
61
-
62
-
63
-
64
-
65
-
66
-
67
-
68
-
69
-
70
-
71
-
72
-
73
-
74
-
75
-
76
-
77
-
78
-
79
-
80
-
81
-
82
-
83
-
84
-
85
-
86
-
87
-
88
-
89
-
90
-
91
-
92
-
93
-
94
-
95
-
96
-
97
-
98
-
99
-
100
-
101
-
102
-
103
-
 104
104 -
 105
105 -
 106
106 -
 107
107 -
 108
108 -
 109
109 -
 110
110 -
 111
111 -
 112
112 -
 113
113 -
 114
114 -
 115
115 -
 116
116 -
 117
117 -
 118
118 -
 119
119 -
 120
120 -
 121
121 -
 122
122 -
 123
123 -
 124
124 -
125
-
126
-
127
-
128
-
129
-
130
-
131
 |
 |

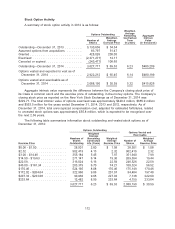
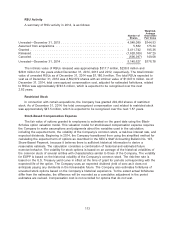
Stock Option Activity
A summary of stock option activity in 2014 is as follows:
Weighted-
Average
Options Outstanding Remaining Aggregate
Weighted- Contractual Intrinsic
Number of Average Term Value
Shares Exercise Price (in years) (in thousands)
Outstanding—December 31, 2013 .......... 5,130,636 $ 34.54
Assumed options from acquisitions ......... 83,797 51.47
Granted ............................. 428,026 208.05
Exercised ........................... (2,371,271) 14.17
Canceled or expired .................... (243,471) 108.65
Outstanding—December 31, 2014 .......... 3,027,717 $ 69.53 6.23 $485,209
Options vested and expected to vest as of
December 31, 2014 .................. 2,922,212 $ 65.45 6.14 $480,199
Options vested and exercisable as of
December 31, 2014 .................. 2,088,190 $ 30.59 5.32 $415,826
Aggregate intrinsic value represents the difference between the Company’s closing stock price of
its Class A common stock and the exercise price of outstanding, in-the-money options. The Company’s
closing stock price as reported on the New York Stock Exchange as of December 31, 2014 was
$229.71. The total intrinsic value of options exercised was approximately $440.3 million, $655.9 million
and $553.5 million for the years ended December 31, 2014, 2013 and 2012, respectively. As of
December 31, 2014, total unrecognized compensation cost, adjusted for estimated forfeitures, related
to unvested stock options was approximately $55.8 million, which is expected to be recognized over
the next 2.56 years.
The following table summarizes information about outstanding and vested stock options as of
December 31, 2014:
Options Outstanding
Options Vested and
Weighted Exercisable
Average
Numbers of Remaining Weighted Weighted
Shares Contractual Average Number of Average
Exercise Price Outstanding Life (Years) Exercise Price Shares Exercise Price
$0.06 - $1.50 ................ 28,501 2.60 $ 1.08 28,501 $ 1.08
$2.32 ..................... 902,415 4.13 2.32 902,415 2.32
$3.00 - $14.46 ............... 355,184 5.45 7.97 351,940 7.99
$14.50 - $19.63 .............. 271,147 6.14 19.30 209,554 19.44
$22.59 ..................... 316,524 6.16 22.59 246,526 22.59
$45.00 - $161.34 ............. 203,379 6.70 74.21 108,324 56.52
$170.46 .................... 524,195 8.08 170.46 175,149 170.46
$172.02 - $204.04 ............ 322,960 9.06 201.57 54,484 197.48
$207.33 - $233.08 ............ 90,930 9.65 227.93 7,138 222.69
$233.64 .................... 12,482 8.59 233.64 4,159 233.64
3,027,717 6.23 $ 69.53 2,088,190 $ 30.59
112