LinkedIn 2014 Annual Report Download - page 103
Download and view the complete annual report
Please find page 103 of the 2014 LinkedIn annual report below. You can navigate through the pages in the report by either clicking on the pages listed below, or by using the keyword search tool below to find specific information within the annual report.-
 1
1 -
2
-
3
-
4
-
5
-
6
-
7
-
8
-
9
-
10
-
11
-
12
-
13
-
14
-
15
-
16
-
17
-
18
-
19
-
20
-
21
-
22
-
23
-
24
-
25
-
26
-
27
-
28
-
29
-
30
-
31
-
32
-
33
-
34
-
35
-
36
-
37
-
38
-
39
-
40
-
41
-
42
-
43
-
44
-
45
-
46
-
47
-
48
-
49
-
50
-
51
-
52
-
53
-
54
-
55
-
56
-
57
-
58
-
59
-
60
-
61
-
62
-
63
-
64
-
65
-
66
-
67
-
68
-
69
-
70
-
71
-
72
-
73
-
74
-
75
-
76
-
77
-
78
-
79
-
80
-
81
-
82
-
83
-
84
-
85
-
86
-
87
-
88
-
89
-
90
-
91
-
92
-
 93
93 -
 94
94 -
 95
95 -
 96
96 -
 97
97 -
 98
98 -
 99
99 -
 100
100 -
 101
101 -
 102
102 -
 103
103 -
 104
104 -
 105
105 -
 106
106 -
 107
107 -
 108
108 -
 109
109 -
 110
110 -
 111
111 -
 112
112 -
 113
113 -
114
-
115
-
116
-
117
-
118
-
119
-
120
-
121
-
122
-
123
-
124
-
125
-
126
-
127
-
128
-
129
-
130
-
131
 |
 |

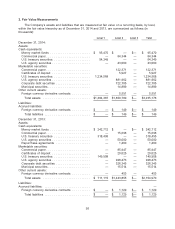
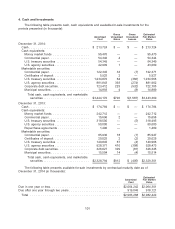
4. Cash and Investments
The following table presents cash, cash equivalents and available-for-sale investments for the
periods presented (in thousands):
Gross Gross Estimated
Amortized Unrealized Unrealized Fair Market
Cost Gains Losses Value
December 31, 2014:
Cash ................................. $ 213,724 $ — $ — $ 213,724
Cash equivalents:
Money market funds .................... 95,470 — — 95,470
Commercial paper ...................... 54,340 4 — 54,344
U.S. treasury securities .................. 54,349 — — 54,349
U.S. agency securities ................... 42,999 1 — 43,000
Marketable securities:
Commercial paper ...................... 122,345 33 (7) 122,371
Certificates of deposit ................... 5,925 2 — 5,927
U.S. treasury securities .................. 1,234,870 64 (366) 1,234,568
U.S. agency securities ................... 881,843 393 (274) 881,962
Corporate debt securities ................. 723,412 225 (932) 722,705
Municipal securities ..................... 14,893 4 (8) 14,889
Total cash, cash equivalents, and marketable
securities ......................... $3,444,170 $726 $(1,587) $3,443,309
December 31, 2013:
Cash ................................. $ 174,784 $ — $ — $ 174,784
Cash equivalents:
Money market funds .................... 242,712 — — 242,712
Commercial paper ...................... 15,696 2 — 15,698
U.S. treasury securities .................. 318,500 — (5) 318,495
U.S. agency securities ................... 50,000 — — 50,000
Repurchase agreements ................. 1,400 — — 1,400
Marketable securities:
Commercial paper ...................... 85,930 18 (1) 85,947
Certificates of deposit ................... 20,025 2 (2) 20,025
U.S. treasury securities .................. 149,845 67 (4) 149,908
U.S. agency securities ................... 928,371 410 (308) 928,473
Corporate debt securities ................. 326,027 399 (81) 326,345
Municipal securities ..................... 15,504 14 (4) 15,514
Total cash, cash equivalents, and marketable
securities ......................... $2,328,794 $912 $ (405) $2,329,301
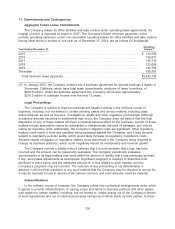
The following table presents available-for-sale investments by contractual maturity date as of
December 31, 2014 (in thousands):
Estimated
Amortized Fair Market
Cost Value
Due in one year or less ...................................... $2,064,242 $2,064,301
Due after one year through two years ............................ 919,046 918,121
Total ................................................. $2,983,288 $2,982,422
101