LeapFrog 2004 Annual Report Download - page 3
Download and view the complete annual report
Please find page 3 of the 2004 LeapFrog annual report below. You can navigate through the pages in the report by either clicking on the pages listed below, or by using the keyword search tool below to find specific information within the annual report.-
 1
1 -
 2
2 -
 3
3 -
 4
4 -
 5
5 -
 6
6 -
 7
7 -
 8
8 -
 9
9 -
 10
10 -
 11
11 -
 12
12 -
 13
13 -
 14
14 -
15
-
16
-
17
-
18
-
19
-
20
-
21
-
22
-
23
-
24
-
25
-
26
-
27
-
28
-
29
-
30
-
31
-
32
-
33
-
34
-
35
-
36
-
37
-
38
-
39
-
40
-
41
-
42
-
43
-
44
-
45
-
46
-
47
-
48
-
49
-
50
-
51
-
52
-
53
-
54
-
55
-
56
-
57
-
58
-
59
-
60
-
61
-
62
-
63
-
64
-
65
-
66
-
67
-
68
-
69
-
70
-
71
-
72
-
73
-
74
-
75
-
76
-
77
-
78
-
79
-
80
-
81
-
82
-
83
-
84
-
85
-
86
-
87
-
88
-
89
-
90
-
91
-
92
-
93
-
94
-
95
-
96
-
97
-
98
-
99
-
100
-
101
-
102
-
103
-
104
-
105
-
106
-
107
-
108
-
109
-
110
-
111
-
112
-
113
-
114
-
115
-
116
-
117
-
118
-
119
-
120
-
121
-
122
-
123
-
124
-
125
-
126
-
127
-
128
-
129
-
130
-
131
-
132
-
133
-
134
-
135
-
136
-
137
-
138
-
139
-
140
-
141
-
142
-
143
-
144
-
145
-
146
-
147
-
148
-
149
-
150
-
151
-
152
-
153
-
154
-
155
-
156
-
157
-
158
-
159
-
160
 |
 |

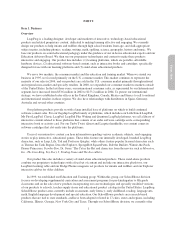
As with any company that has the degree of success that we have had in such a short time, there will be growing
pains, and 2004 was a disappointing year for us. After a number of years of incredible growth and success, our 2004
net sales declined 6%, and we reported a loss of $0.11 per share.
The decline in our fi nancial performance can be traced entirely to our U. S. consumer business. We had lower sales
of our more established platforms and related software, primarily the LeapPad family of products. Nonetheless, we
still see this educational platform as an exciting and viable business, parents still recognize it as a great educational
tool and children know that it is fun. Also, we are seeing the growing popularity of our screen-based Leapster
handheld and of our younger-aged focused LittleTouch platform, each of which have achieved great acceptance by
parents and children.
Our rapid growth had also outpaced our ability to establish superior internal operational capabilities. We have expe-
rienced problems with our supply chain, our information technology systems and other business processes in the
company. This has hurt our margins, and possibly caused us to have some lost sales. Although we believe that
many of these problems are behind us, we know that we have many improvements to make, and improving our
operational infrastructure and processes will be a major area of focus for us in 2005.
The U.S. Consumer segment performance and operational diffi culties masked the continued strong performance in
our International and SchoolHouse businesses, both of which performed well. In 2004, our International Segment
net sales were up 59% and our SchoolHouse net sales were up 47%. We see this as a strong validation of our business
model and evidence of the progress we have made over the last several years.
Our plans going forward are built on the educational foundation of LeapFrog and the knowledge and commitment
that we can and must improve our fi nancial performance. For that reason, the entire management team is focused
on a three-prong plan:
1. Restore profi tability;
2. Strengthen our infrastructure and business processes; and
3. Generate growth.
Restore Profi tability. Our cost base has grown rapidly as our sales have increased and our operations have expanded.
We struggled to keep up with the growth of our business and often simply added more people to address adminis-
trative and operational issues instead of implementing effi cient, scalable processes and infrastructure. This put our
cost structure out of balance and resulted in reduced profi tability for the company. For that reason, we recently
restructured our workforce by eliminating over 180 full-time and temporary employees in the U.S. Consumer and
International segments. We expect headcount increases in the SchoolHouse division to partially offset these
reductions.
In addition to the cost reductions, we have also embarked on a deliberate strategy to better leverage our assets and
investments to improve returns. This includes leveraging technology across products and platforms; utilizing our
content assets and development tools across divisions; and realizing the global potential of the products from the
outset of our product development planning cycle to minimize development costs and to maximize sales and profi tability.
“My six-year old daughter, Libby, has had her LeapPad for about two years and it continues to be
one of her favorite toys. She especially loves taking it on long trips, where she can use the map page
to show us how we’re getting there. It has helped her reading skills tremendously as well, but to her
it’s simply FUN!”
— Chris K. Cleveland, Ohio.
“I teach kindergarten and my partner teacher and I have seen a trend within the last two years.
The children who use the LeapPad learning system have an advantage over their peers ...these
children are able to master our kindergarten assessment at a faster rate than their peers. It is such
a wonderful tool that I went out and bought one for my own children. As a parent and a teacher,
I love all LeapFrog products.... Thank you for making learning fun!”
— Jana B. Olympia, Washington.