JetBlue Airlines 2014 Annual Report Download - page 61
Download and view the complete annual report
Please find page 61 of the 2014 JetBlue Airlines annual report below. You can navigate through the pages in the report by either clicking on the pages listed below, or by using the keyword search tool below to find specific information within the annual report.-
 1
1 -
2
-
3
-
4
-
5
-
6
-
7
-
8
-
9
-
10
-
11
-
12
-
13
-
14
-
15
-
16
-
17
-
18
-
19
-
20
-
21
-
22
-
23
-
24
-
25
-
26
-
27
-
28
-
29
-
30
-
31
-
32
-
33
-
34
-
35
-
36
-
37
-
38
-
39
-
40
-
41
-
42
-
43
-
44
-
45
-
46
-
47
-
48
-
49
-
50
-
 51
51 -
 52
52 -
 53
53 -
 54
54 -
 55
55 -
 56
56 -
 57
57 -
 58
58 -
 59
59 -
 60
60 -
 61
61 -
 62
62 -
 63
63 -
 64
64 -
 65
65 -
 66
66 -
 67
67 -
 68
68 -
 69
69 -
 70
70 -
 71
71 -
72
-
73
-
74
-
75
-
76
-
77
-
78
-
79
-
80
-
81
-
82
-
83
-
84
-
85
-
86
-
87
-
88
-
89
-
90
-
91
-
92
-
93
-
94
-
95
-
96
 |
 |

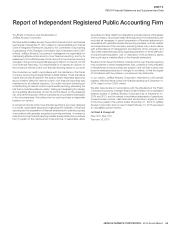
JETBLUE AIRWAYS CORPORATION-2014Annual Report 55
PART II
ITEM 8Financial Statements and Supplementary Data
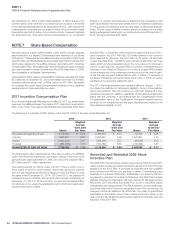
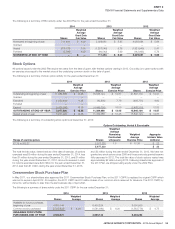
The following is a summary of RSU activity under the 2002 Plan for the year ended December 31:
2014 2013 2012
Shares
Weighted
Average
Grant Date
Fair Value Shares
Weighted
Average
Grant Date
Fair Value Shares
Weighted
Average
Grant Date
Fair Value
Nonvested at beginning of year 711,494 $ 6.00 2,029,081 $ 5.85 4,093,484 $ 5.64
Granted — — — — — —
Vested (708,728) 6.00 (1,257,045) 5.76 (1,921,940) 5.41
Forfeited (2,766) 6.03 (60,542) 5.99 (142,463) 5.76
NONVESTED AT END OF YEAR — $ — 711,494 $ 6.00 2,029,081 $ 5.85
Stock Options
All options issued under the 2002 Plan expire ten years from the date of grant, with the last options vesting in 2012. Our policy is to grant options with
an exercise price equal to the market price of the underlying common stock on the date of grant.
The following is a summary of stock option activity for the years ended December 31:
2014 2013 2012
Shares
Weighted
Average
Exercise Price Shares
Weighted
Average
Exercise Price Shares
Weighted
Average
Exercise Price
Outstanding at beginning of year 11,384,688 $ 13.45 15,845,124 $ 14.87 21,807,170 $ 13.91
Granted — — — — — —
Exercised (1,950,482) 11.58 (10,800) 7.79 (493,731) 4.00
Forfeited — — — — — —
Expired (3,456,986) 16.38 (4,449,636) 18.50 (5,468,315) 12.03
OUTSTANDING AT END OF YEAR 5,977,220 $ 12.38 11,384,688 $ 13.45 15,845,124 $ 14.87
Vested at end of year 5,977,220 $ 12.38 11,384,688 $ 13.45 15,845,124 $ 14.87
The following is a summary of outstanding stock options at December 31, 2014:
Range of exercise prices
Options Outstanding, Vested & Exercisable
Shares
Weighted
Average
Remaining
Contractual
Life (years)
Weighted
Average
Exercise Price
Aggregate
Intrinsic Value
(millions)
$7.79 to $15.27 5,977,220 1.3 $ 12.38 $ 22
5,977,220 $ 22
The total intrinsic value, determined as of the date of exercise, of options
exercised was $5 million during the year ended December 31, 2014, less
than $1 million during the year ended December 31, 2013, and $1 million
during the year ended December 31, 2012. Amounts received in cash
for options exercised were $22 million for the year ended December 31,
2014, less than $1 million during the year ended December 31, 2013,
and $2 million during the year ended December 31, 2012. We have not
granted any stock options since 2008 and those previously granted became
fully expensed in 2012. The total fair value of stock options vested was
approximately $2 million during 2012. Following shareholder approval of
the 2011 Plan, we stopped using equity under the 2002 Plan.
Crewmember Stock Purchase Plan
In May 2011, our shareholders also approved the 2011 Crewmember Stock Purchase Plan, or the 2011 CSPP, to replace the original CSPP which
was set to expire in April 2012. At inception, the 2011 CSPP had 8.0 million shares of our common stock reserved for issuance. The 2011 CSPP, by
its terms, will terminate no later than the last business day of April 2021.
The following is a summary of share activity under the 2011 CSPP for the year ended December 31:
2014 2013 2012
Shares
Weighted
Average Shares
Weighted
Average Shares
Weighted
Average
Available for future purchases,
beginning of year 4,855,144 6,436,224 8,000,000
Common stock purchased (2,332,823) $ 8.04 (1,581,080) $ 6.20 (1,563,776) $ 4.75
AVAILABLE FOR FUTURE
PURCHASES, END OF YEAR 2,552,321 4,855,144 6,436,224