JetBlue Airlines 2014 Annual Report Download - page 29
Download and view the complete annual report
Please find page 29 of the 2014 JetBlue Airlines annual report below. You can navigate through the pages in the report by either clicking on the pages listed below, or by using the keyword search tool below to find specific information within the annual report.-
 1
1 -
2
-
3
-
4
-
5
-
6
-
7
-
8
-
9
-
10
-
11
-
12
-
13
-
14
-
15
-
16
-
17
-
18
-
 19
19 -
 20
20 -
 21
21 -
 22
22 -
 23
23 -
 24
24 -
 25
25 -
 26
26 -
 27
27 -
 28
28 -
 29
29 -
 30
30 -
 31
31 -
 32
32 -
 33
33 -
 34
34 -
 35
35 -
 36
36 -
 37
37 -
 38
38 -
 39
39 -
40
-
41
-
42
-
43
-
44
-
45
-
46
-
47
-
48
-
49
-
50
-
51
-
52
-
53
-
54
-
55
-
56
-
57
-
58
-
59
-
60
-
61
-
62
-
63
-
64
-
65
-
66
-
67
-
68
-
69
-
70
-
71
-
72
-
73
-
74
-
75
-
76
-
77
-
78
-
79
-
80
-
81
-
82
-
83
-
84
-
85
-
86
-
87
-
88
-
89
-
90
-
91
-
92
-
93
-
94
-
95
-
96
 |
 |

JETBLUE AIRWAYS CORPORATION-2014Annual Report 23
PART II
ITEM6Selected Financial Data
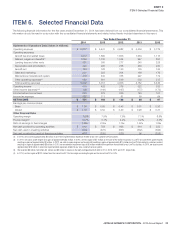
ITEM6. Selected Financial Data
The following financial information for the five years ended December 31, 2014 has been derived from our consolidated financial statements. This
information should be read in conjunction with the consolidated financial statements and related notes thereto included elsewhere in this report.
Year Ended December 31,
2014 2013 2012 2011 2010
Statements of Operations Data (dollars in millions):
Operating revenues $ 5,817 $ 5,441 $ 4,982 $ 4,504 $ 3,779
Operating expenses:
Aircraft fuel and related taxes 1,912 1,899 1,806 1,664 1,115
Salaries, wages and benefits(1) 1,294 1,135 1,044 947 891
Landing fees and other rents 321 305 277 245 228
Depreciation and amortization 320 290 258 233 220
Aircraft rent 124 128 130 135 126
Sales and marketing 231 223 204 199 179
Maintenance materials and repairs 418 432 338 227 172
Other operating expenses(2) 682 601 549 532 515
Total operating expenses 5,302 5,013 4,606 4,182 3,446
Operating income 515 428 376 322 333
Other income (expense)(3)(4) 108 (149) (167) (177) (172)
Income before income taxes 623 279 209 145 161
Income tax expense 222 111 81 59 64
NET INCOME $ 401 $ 168 $ 128 $ 86 $ 97
Earnings per common share:
Basic $ 1.36 $ 0.59 $ 0.45 $ 0.31 $ 0.36
Diluted $ 1.19 $ 0.52 $ 0.40 $ 0.28 $ 0.31
Other Financial Data:
Operating margin 8.9% 7.9% 7.5% 7.1% 8.8%
Pre-tax margin(4) 10.7% 5.1% 4.2% 3.2% 4.3%
Ratio of earnings to fixed charges 3.59x 2.05x 1.75x 1.52x 1.59x
Net cash provided by operating activities $ 912 $ 758 $ 698 $ 614 $ 523
Net cash used in investing activities (379) (476) (867) (502) (696)
Net cash provided by (used in) financing activities (417) (239) (322) 96 (258)
(1) In 2010, we incurred approximately $9 million in one-time implementation expenses related to our new customer service system.
(2) In 2014, we sold a spare engine for a gain of approximately $3 million. In 2013, we had a gain of $7 million on the sale of the Airfone business by LiveTV and sold three spare engines
resulting in gains of approximately $2 million. In 2012, we sold six spare engines and two aircraft resulting in gains of approximately $10 million and LiveTV terminated a customer contract
resulting in a gain of approximately $8 million. In 2010, we recorded an impairment loss of $6 million related to the spectrum license held by our LiveTV subsidiary. In 2010, we also incurred
approximately $13 million in one-time implementation expenses related to our new customer service system.
(3) We recorded $3 million, $3 million, $1 million and $6 million in losses on the early extinguishment of debt in 2014, 2013, 2012 and 2011 respectively.
(4) In 2014, we had a gain of $241 million from the sale of LiveTV. Pre-tax margin excluding the gain on the sale of LiveTV is 6.6%.