JetBlue Airlines 2014 Annual Report Download - page 28
Download and view the complete annual report
Please find page 28 of the 2014 JetBlue Airlines annual report below. You can navigate through the pages in the report by either clicking on the pages listed below, or by using the keyword search tool below to find specific information within the annual report.-
 1
1 -
2
-
3
-
4
-
5
-
6
-
7
-
8
-
9
-
10
-
11
-
12
-
13
-
14
-
15
-
16
-
17
-
 18
18 -
 19
19 -
 20
20 -
 21
21 -
 22
22 -
 23
23 -
 24
24 -
 25
25 -
 26
26 -
 27
27 -
 28
28 -
 29
29 -
 30
30 -
 31
31 -
 32
32 -
 33
33 -
 34
34 -
 35
35 -
 36
36 -
 37
37 -
 38
38 -
39
-
40
-
41
-
42
-
43
-
44
-
45
-
46
-
47
-
48
-
49
-
50
-
51
-
52
-
53
-
54
-
55
-
56
-
57
-
58
-
59
-
60
-
61
-
62
-
63
-
64
-
65
-
66
-
67
-
68
-
69
-
70
-
71
-
72
-
73
-
74
-
75
-
76
-
77
-
78
-
79
-
80
-
81
-
82
-
83
-
84
-
85
-
86
-
87
-
88
-
89
-
90
-
91
-
92
-
93
-
94
-
95
-
96
 |
 |

JETBLUE AIRWAYS CORPORATION-2014Annual Report22
PART II
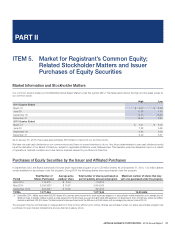
ITEM5Market for Registrant’s Common Equity; Related Stockholder Matters and Issuer Purchases of Equity Securities
Convertible Debt Redemption
During the fourth quarter of 2014, all holders of our 6.75% Convertible Debentures due 2039 (Series A) elected to convert their holdings into shares of
our common stock at a rate of 204.6036 shares per $1,000 debenture for a total of approximately 15.5 million shares.
Stock Performance Graph
This performance graph shall not be deemed “filed” with the SEC or subject to Section 18 of the Exchange Act, nor shall it be deemed incorporated by
reference in any of our filings under the Securities Act of 1933, as amended.
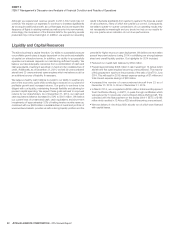
The following line graph compares the cumulative total stockholder return on our common stock with the cumulative total return of the Standard &
Poor’s 500 Stock Index and the NYSE Arca Airline Index from December 31, 2010 to December 31, 2014. The comparison assumes the investment of
$100 in our common stock and in each of the foregoing indices and reinvestment of all dividends. The stock performance shown represents historical
performance and is not representative of future stock performance.
JetBlue Airways Corporation NYSE Arca Airline Index(1)
S&P 500 Stock Index
12/31/10 12/31/1312/31/1212/31/11 12/31/14
In $
60
80
100
120
140
160
180
200
220
240
260
12/31/2010 12/31/2011 12/31/2012 12/31/2013 12/31/2014
JetBlue Airways Corporation $ 100 $ 79 $ 87 $ 129 $ 240
S&P 500 Stock Index 100 102 118 157 178
NYSE Arca Airline Index(1) 100 69 94 148 222
(1) As of December 31, 2014, the NYSE Arca Airline Index consisted of Air Canada, Alaska Air Group Inc., Allegiant Travel Company, American Airlines Group, Inc., Delta Air Lines, Inc., JetBlue
Airways Corporation, Republic Airways Holding, Inc., Southwest Airlines Company, Transat A.T. Inc. (Cl B), United Continental Holdings Inc. and WestJet Airlines Ltd.