Hyundai 2009 Annual Report Download - page 56
Download and view the complete annual report
Please find page 56 of the 2009 Hyundai annual report below. You can navigate through the pages in the report by either clicking on the pages listed below, or by using the keyword search tool below to find specific information within the annual report.-
 1
1 -
2
-
3
-
4
-
5
-
6
-
7
-
8
-
9
-
10
-
11
-
12
-
13
-
14
-
15
-
16
-
17
-
18
-
19
-
20
-
21
-
22
-
23
-
24
-
25
-
26
-
27
-
28
-
29
-
30
-
31
-
32
-
33
-
34
-
35
-
36
-
37
-
38
-
39
-
40
-
41
-
42
-
43
-
44
-
45
-
 46
46 -
 47
47 -
 48
48 -
 49
49 -
 50
50 -
 51
51 -
 52
52 -
 53
53 -
 54
54 -
 55
55 -
 56
56 -
 57
57 -
 58
58 -
 59
59 -
 60
60 -
 61
61 -
 62
62 -
 63
63 -
 64
64 -
 65
65 -
 66
66 -
67
-
68
-
69
-
70
-
71
-
72
-
73
 |
 |

HYUNDAI MOTOR COMPANY I 2010 ANNUAL REPORT I 111HYUNDAI MOTOR COMPANY I 2010 ANNUAL REPORT I 110
HYUNDAI MOTOR COMPANY
>>
NOTES TO CONSOLIDATED FINANCIAL STATEMENTS FOR THE YEARS ENDED DECEMBER 31, 2009 AND 2008
HYUNDAI MOTOR COMPANY
>>
NOTES TO CONSOLIDATED FINANCIAL STATEMENTS FOR THE YEARS ENDED DECEMBER 31, 2009 AND 2008
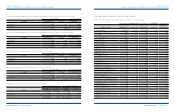
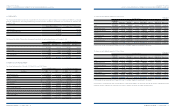
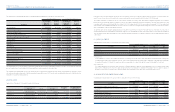
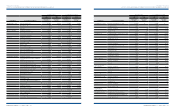
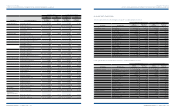
23. DIVIDENDS:
The computation of the proposed dividends for 2009 is as follows:
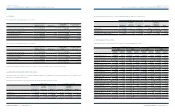
The computation of the proposed dividends for 2008 is as follows:
Number of shares Dividend rate
Korean Won
in millions
U. S. Dollars (Note 2)
in thousands
Common shares, net of treasury shares 209,275,129 23% ₩ 240,666 $ 206,120
Preferred shares, net of treasury shares:
First and Third preferred shares 25,637,321 24% 30,766 26,350
Second preferred shares 36,613,865 25% 45,767 39,198
₩ 317,199 $ 271,668
Number of shares Dividend rate
Korean Won
in millions
U. S. Dollars (Note 2)
in thousands
Common shares, net of treasury shares 209,244,738 17% ₩ 177,859 $ 152,329
Preferred shares, net of treasury shares:
First and Third preferred shares 25,637,321 18% 23,073 19,761
Second preferred shares 36,613,865 19% 34,783 29,790
₩ 235,715 $ 201,880
The payout ratios (dividends declared/net income) are 10.7% and 27.5% for the years ended December 31, 2009 and 2008, respectively.
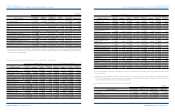
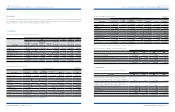
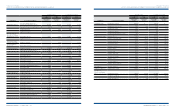
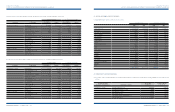
24. ELIMINATION OF UNREALIZED PROFITS AND LOSSES:
Unrealized profits and losses resulting from sales among consolidated subsidiaries are calculated based on the average gross margin rate of selling companies and are
eliminated in the consolidated financial statements.
Unrealized profits and losses related to sales of inventories and property, plant and equipment in 2009 are as follows:
Inventories
Property,
plant and
equipment Others Inventories
Property,
plant and
equipment Others
Upstream sales ₩ 4,149 ₩ - ₩ - $ 3,553 $ - $ -
Downstream sales 485,331 227,996 (146,878) 415,665 195,269 (125,795)
Sales between consolidated subsidiaries 429,186 8,091 (45,584) 367,580 6,930 (39,041)
Korean Won in millions U.S. Dollars (Note 2) in thousands
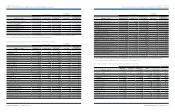
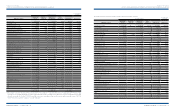
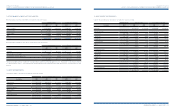
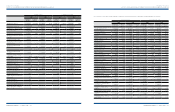
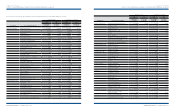
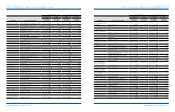
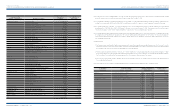
25. INTER-COMPANY TRANSACTIONS:
Significant transactions in 2009 and 2008 between the Company and consolidated subsidiaries are as follows:
Company’s
income
Company’s
expenses
Company’s
income
Company’s
expenses
Company’s
income
Company’s
expenses
Company’s
income
Company’s
expenses
Hyundai Capital Service Inc. ₩ 845,385 ₩ 44,971 ₩ 687,693 ₩ 40,285 $ 724,036 $ 38,516 $ 588,980 $ 34,502
Kia Motors Corporation 316,083 285,785 528,339 200,651 270,712 244,763 452,500 171,849
Hyundai WIA Corporation 207,005 292,168 154,000 334,713 177,291 250,230 131,894 286,668
Dymos Inc. 751 470,683 620 444,376 643 403,120 531 380,589
Hyundai PowerTech Co., Ltd. 12,759 437,019 28,154 231,322 10,928 374,288 24,113 198,118
KEFICO Corporation 440 300,141 379 363,791 377 257,058 325 311,572
Hyundai HYSCO 14,323 236,784 2,277 228,899 12,267 202,795 1,950 196,042
Hyundai Commercial Inc. 191,005 2,973 - - 163,588 2,546 - -
Autoever Systems Corp. 532 183,187 524 175,608 456 156,892 449 150,401
Hyundai Card Co., Ltd. 1,356 110,105 2,112 74,546 1,161 94,300 1,809 63,845
METIA Corporation 974 47,094 2,162 47,788 834 40,334 1,852 40,928
Hyundai Autonet Co., Ltd. 138 41,795 1,452 112,340 118 35,796 1,244 96,214
Haevichi Hotel & Resort Co., Ltd. 9,020 10,276 109 8,510 7,725 8,801 93 7,288
Partecs Company, Ltd. 67 16,680 61 16,339 57 14,286 52 13,994
Hyundai Rotem Company 2,796 1,989 4,070 8,306 2,395 1,703 3,486 7,114
Automobile Industrial Ace Corporation 911 3,035 829 1,905 780 2,599 710 1,632
M & Soft Co., Ltd. 1,182 933 94 741 1,012 799 81 635
Haevichi Country Club Co., Ltd. 126 1,077 51 627 108 922 44 537
Mseat Co., Ltd. 22 - 67 - 19 - 57 -
Korean Won in millions
U.S. Dollars (Note 2)
in thousands
2009 2008 20082009
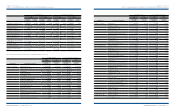
Inventories
Property,
plant and
equipment Others Inventories
Property,
plant and
equipment Others
Upstream sales ₩ 5,641 ₩ - ₩ - $ 4,831 $ - $ -
Downstream sales 760,538 177,669 (231,248) 651,369 152,166 (198,054)
Sales between consolidated subsidiaries 350,594 10,100 (71,909) 300,269 8,650 (61,587)
Korean Won in millions U.S. Dollars (Note 2) in thousands
Unrealized profits and losses related to sales of inventories and property, plant and equipment in 2008 are as follows: