Hyundai 2009 Annual Report Download - page 51
Download and view the complete annual report
Please find page 51 of the 2009 Hyundai annual report below. You can navigate through the pages in the report by either clicking on the pages listed below, or by using the keyword search tool below to find specific information within the annual report.-
 1
1 -
2
-
3
-
4
-
5
-
6
-
7
-
8
-
9
-
10
-
11
-
12
-
13
-
14
-
15
-
16
-
17
-
18
-
19
-
20
-
21
-
22
-
23
-
24
-
25
-
26
-
27
-
28
-
29
-
30
-
31
-
32
-
33
-
34
-
35
-
36
-
37
-
38
-
39
-
40
-
 41
41 -
 42
42 -
 43
43 -
 44
44 -
 45
45 -
 46
46 -
 47
47 -
 48
48 -
 49
49 -
 50
50 -
 51
51 -
 52
52 -
 53
53 -
 54
54 -
 55
55 -
 56
56 -
 57
57 -
 58
58 -
 59
59 -
 60
60 -
 61
61 -
62
-
63
-
64
-
65
-
66
-
67
-
68
-
69
-
70
-
71
-
72
-
73
 |
 |

HYUNDAI MOTOR COMPANY I 2010 ANNUAL REPORT I 101HYUNDAI MOTOR COMPANY I 2010 ANNUAL REPORT I 100
HYUNDAI MOTOR COMPANY
>>
NOTES TO CONSOLIDATED FINANCIAL STATEMENTS FOR THE YEARS ENDED DECEMBER 31, 2009 AND 2008
HYUNDAI MOTOR COMPANY
>>
NOTES TO CONSOLIDATED FINANCIAL STATEMENTS FOR THE YEARS ENDED DECEMBER 31, 2009 AND 2008
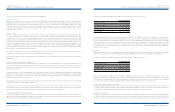
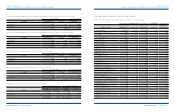
10. INSURANCE:
As of December 31, 2009, certain property, plant and equipment, inventories, cash and cash equivalents and securities are insured for ₩21,720,882million (US$18,603,016
thousand). In addition, the Company carries products and completed operations liability insurance with a maximum coverage of ₩297,116 million (US$254,467 thousand)
and general insurance for vehicles and workers’ compensation and casualty insurance for employees.
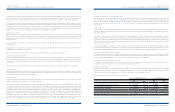
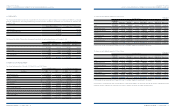
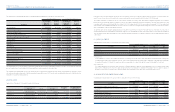
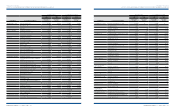
11. INTANGIBLES:
Intangibles as of December 31, 2009 and 2008 consist of the following:
Description
Acquisition
cost
Accumulated
amortization
Accumulated
impairment
loss
Government
subsidy Book value Book value Book value Book value
Goodwill ₩ 634,062 ₩ (229,429) ₩ (467) ₩ - ₩ 404,166 ₩ 514,518 $ 346,151 $ 440,663
Negative goodwill (98,671) 36,595 - - (62,076) (68,167) (53,165) (58,382)
Industrial property rights 89,706 (69,549) (121) - 20,036 21,454 17,160 18,374
Development costs 7,284,029 (3,871,562) (186,646) (53,890) 3,171,931 2,799,538 2,716,625 2,397,686
Other 379,943 (203,512) (2,301) - 174,130 181,514 149,134 155,459
₩ 8,289,069 ₩ (4,337,457) ₩ (189,535) ₩ (53,890) ₩ 3,708,187 ₩ 3,448,857 $ 3,175,905 $ 2,953,800
Korean Won in millions
U.S. Dollars (Note 2)
in thousands
2008200920082009
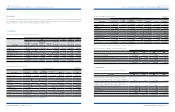
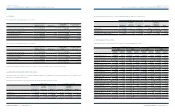
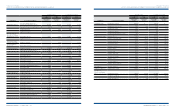
Description Goodwill
Negative
goodwill
Industrial
property rights
Development
costs Other Total Total
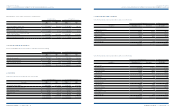
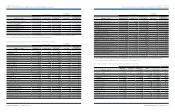
Beginning of the year ₩ 514,518 ₩ (68,167) ₩ 21,454 ₩ 2,799,538 ₩ 181,514 ₩ 3,448,857 $ 2,953,800
Addition:
Expenditures - - 6,670 1,360,814 61,794 1,429,278
1,224,116
Deduction:
Amortization (44,773) 6,091 (4,869) (808,682) (55,611) (907,844) (777,530)
Impairment loss (467) - - (149,817) - (150,284)
(128,712)
Government subsidy - - - (4,653) - (4,653)
(3,985)
Other (*) (65,112) - (3,219) (25,269) (13,567) (107,167)
(91,784)
End of the year ₩ 404,166 ₩ (62,076) ₩ 20,036 ₩ 3,171,931 ₩ 174,130 ₩ 3,708,187 $ 3,175,905
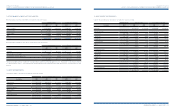
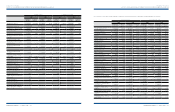
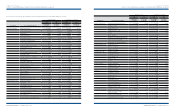
Description Goodwill
Negative
goodwill
Industrial
property rights
Development
costs Other Total Total
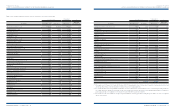
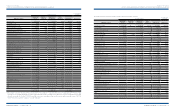
Beginning of the year ₩ 510,731 ₩ (73,472) ₩ 27,599 ₩ 2,414,822 ₩ 118,204 ₩ 2,997,884 $ 2,567,561
Addition:
Expenditures 34,763 - 11,217 1,170,791 64,184
1,280,955 1,097,084
Deduction:
Amortization (30,870) 5,270 (9,682) (776,680) (37,849) (849,811) (727,827)
Impairment loss - - - (2,747) -
(2,747) (2,353)
Government subsidy - - - (26,633) -
(26,633) (22,810)
Other (*) (106) 35 (7,680) 19,985 36,975
49,209 42,145
End of the year ₩ 514,518 ₩ (68,167) ₩ 21,454 ₩ 2,799,538 ₩ 181,514 ₩ 3,448,857 $ 2,953,800
The changes in intangibles in 2009 are as follows:
The changes in intangibles in 2008 are as follows:
(*) Other includes foreign currency adjustment and changes in the scope of consolidation.
Korean Won in millions
Korean Won in millions
U.S. Dollars (Note 2)
in thousands
U.S. Dollars (Note 2)
in thousands
(*) Other includes foreign currency adjustment and changes in the scope of consolidation.
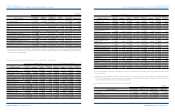
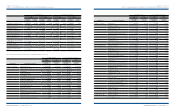
Research and development expenditures in 2009 and 2008 are as follows:
2009 2008 2009 2008
Development cost (capitalized) ₩ 1,360,814 ₩ 1,170,791 $ 1,165,480 $ 1,002,733
Ordinary development (manufacturing cost) 215,273 323,330 184,372 276,918
Research costs (SG&A) 663,384 696,355 568,160 596,399
₩ 2,239,471 ₩ 2,190,476 $ 1,918,012 $ 1,876,050
Korean Won in millions U. S. Dollars (Note 2) in thousands
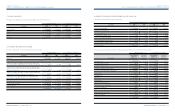
12. OTHER ASSETS:
Other assets as of December 31, 2009 and 2008 consist of the following:
Description 2009 2008 2009 2008
Long-term notes and accounts receivable, net of allowance for doubtful
accounts of ₩617 million in 2009 and ₩121 million in 2008, and unamortized
present value discount of ₩11,259 million in 2009 and ₩9,753 million in 2008 ₩ 62,172 ₩ 31,620 $ 53,248 $ 27,081
Long-term notes and accounts receivable - other, net of allowance for
doubtful accounts of ₩936 million in 2009 and ₩23,275 million in 2008, and
unamortized present valuediscount of nil in 2009 and 2008 170,735 158,379 146,227 135,645
Long-term loans 11,547 300,737 9,890 257,569
Long-term deposits 545,253 776,249 466,986 664,824
Other 184,232 190,937 157,787 163,529
₩ 973,939 ₩ 1,457,922 $ 834,138 $ 1,248,648
Korean Won in millions U. S. Dollars (Note 2) in thousands