Hyundai 2002 Annual Report Download - page 44
Download and view the complete annual report
Please find page 44 of the 2002 Hyundai annual report below. You can navigate through the pages in the report by either clicking on the pages listed below, or by using the keyword search tool below to find specific information within the annual report.-
 1
1 -
2
-
3
-
4
-
5
-
6
-
7
-
8
-
9
-
10
-
11
-
12
-
13
-
14
-
15
-
16
-
17
-
18
-
19
-
20
-
21
-
22
-
23
-
24
-
25
-
26
-
27
-
28
-
29
-
30
-
31
-
32
-
33
-
 34
34 -
 35
35 -
 36
36 -
 37
37 -
 38
38 -
 39
39 -
 40
40 -
 41
41 -
 42
42 -
 43
43 -
 44
44 -
 45
45 -
 46
46
 |
 |

HYUNDAI MOTOR COMPANY AND SUBSIDIARIES: Financial Statements 2002
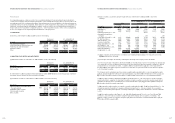
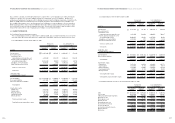
Kia, a domestic subsidiary, is a defendant pertaining to its claim in the in-court reorganization proceeding, the lawsuits
related to its operation such as product liabilities, lawsuits for compensation of losses or damages. Kia also has a
pending lawsuit pertaining to the disputes with the Brazilian Government and the Brazilian shareholders of Asia Motors Do
Brasil S.A. (AMB), which was established as a joint venture by Asia Motors with a Brazilian investor, in Brazilian court.
Also, in 2002, Kia brought the case to the International Court of Arbitration to settle the disputes. Kia, a stockholder of
AMB, had already written off its investment of 14,057 million ($11,710 thousand) and estimates that the above matter
does not and will not affect its financial statements at this time. The outcome of the creditors’ claims in relation to Kia’s
denial of their claims in the in-court reorganization proceedings is not currently determinable.
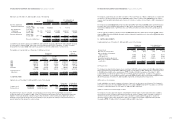
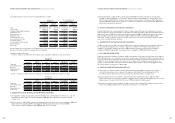
24. SEGMENT INFORMATION
(1) Consolidated financial statements by industry
The consolidated balance sheets as of December 31, 2002 and 2001, and consolidated statements of income for the
years then ended, by industry under which the Company and its subsidiaries’ business are classified, are as follows:
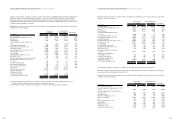
Consolidated Balance Sheet As Of December 31, 2002
Korean won U.S. dollars(Note 2)
(in millions) (in thousands)
Non-financial Financial Non-financial Financial
industry industry industry industry
ASSETS
Current assets: 14,445,860 665,305
$
12,034,205
$
554,236
Non-current assets:
Investments, net of
unamortized present value discount 3,439,440 1,352,270 2,865,245 1,126,516
Property, plant and equipment, net of
accumulated depreciation 16,636,969 108,269 13,859,521 90,194
Intangibles, net of amortization 1,670,883 5,849 1,391,939 4,873
Other financial business assets - 8,386,928 - 6,986,778
Total non-current assets 21,747,292 9,853,316 18,116,705 8,208,361
Total assets 36,193,152 10,518,621 $30,150,910 $8,762,597
LIABILITIES AND
SHAREHOLDERS’ EQUITY
Current liabilities 14,719,420 6,140,458
$
12,262,096
$
5,115,344
Non-current liabilities 8,211,003 3,566,741 6,840,222 2,971,293
Other financial business liabilities - 12,732 - 10,607
Total liabilities 22,930,423 9,719,931 19,102,318 8,097,244
Shareholders’ equity:
Capital stock 1,475,312 476,182 1,229,017 396,686
Capital surplus 5,287,270 43,721 4,404,590 36,422
Retained earnings 3,561,797 286,405 2,967,176 238,591
Capital adjustments (81,940) (7,618) (68,261) (6,346)
Minority interests 3,020,290 - 2,516,070 -
Total shareholders’ equity 13,262,729 798,690 11,048,592 665,353
Total liabilities and shareholders’ equity 36,193,152 10,518,621 $30,150,910 $8,762,597
HYUNDAI MOTOR COMPANY AND SUBSIDIARIES: Financial Statements 2002
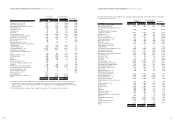
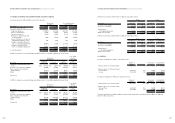
Consolidated Balance Sheet As Of December 31, 2001
Korean won U.S. dollars(Note 2)
(in millions) (in thousands)
Non-financial Financial Non-financial Financial
industry industry industry industry
ASSETS
Current assets: 11,357,794 771,925
$
9,461,674
$
643,056
Non-current assets:
Investments, net of
unamortized present value discount 3,491,920 922,684 2,908,964 768,647
Property, plant and equipment, net of
accumulated depreciation 16,802,095 104,392 13,997,080 86,964
Intangibles, net of amortization 2,145,994 3,777 1,787,732 3,146
Other financial business assets - 5,073,975 - 4,226,904
Total non-current assets 22,440,009 6,104,828 18,693,776 5,085,661
Total assets 33,797,803 6,876,753 $28,155,450 $5,728,717
LIABILITIES AND
SHAREHOLDERS’ EQUITY
Current liabilities 13,479,051 4,438,112
$
11,228,799
$
3,697,194
Other long-term liabilities 8,954,165 1,834,985 7,459,318 1,528,645
Total liabilities 22,433,216 6,273,097 18,688,117 5,225,839
Shareholders’ equity:
Capital stock 1,476,454 399,458 1,229,968 332,771
Capital surplus 5,339,484 33,152 4,448,087 27,618
Retained earnings 2,193,068 158,691 1,826,948 132,198
Capital adjustments (95,031) 12,355 (79,166) 10,292
Minority interests 2,450,612 - 2,041,496 -
Total shareholders’ equity 11,364,587 603,656 9,467,333 502,879
Total liabilities and shareholders’ equity 33,797,803 6,876,753 $28,155,450 $5,728,718
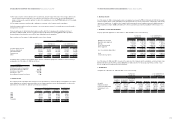
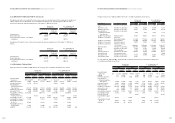
Consolidated Statement of Income for the Year Ended December 31, 2002
Korean won U.S. dollars(Note 2)
(in millions) (in thousands)
Non-financial Financial Non-financial Financial
industry industry industry industry
Sales 46,461,645 1,678,629
$
38,705,135
$
1,398,392
Cost of sales 34,937,000 1,089,731 29,104,465 907,807
Selling and administrative expenses 8,605,494 380,996 7,168,855 317,391
Operating income 2,919,151 207,902 2,431,815 173,194
Other expenses, net 284,157 20,784 236,719 17,314
Ordinary income 2,634,994 187,118 2,195,096 155,880
Extraordinary items, net - - - -
Income before income tax 2,634,994 187,118 2,195,096 155,880
Income tax expense 796,065 57,413 663,166 47,828
Income before minority interests 1,838,929 129,705 1,531,930 108,052
Minority interests 456,792 - 380,533 -
Net income 1,382,137 129,705 $1,151,397 $108,052
86 87