Hyundai 2002 Annual Report Download - page 28
Download and view the complete annual report
Please find page 28 of the 2002 Hyundai annual report below. You can navigate through the pages in the report by either clicking on the pages listed below, or by using the keyword search tool below to find specific information within the annual report.
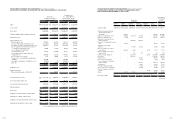
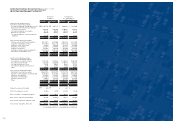
HYUNDAI MOTOR COMPANY AND SUBSIDIARIES: Financial Statements 2002
CONSOLIDATED STATEMENTS OF CASH FLOWS (CONTINUED)
FOR THE YEARS ENDED DECEMBER 31, 2002 AND 2001
Korean won Translation into
(in millions) U. S. dollars (Note 2)
(in thousands)
2002 2001 2002 2001
Cash flows from operating activities:
Cash inflows from investing activities:
Proceeds from disposal of marketable securities 6,487,542 8,445,545 $ 5,404,483 $ 7,035,609
Reduction in short-term financial instruments
and other current assets 4,442,551 4,262,003 3,700,892 3,550,485
Proceeds from disposal of investments 307,792 909,238 256,408 757,446
Reduction in other assets 280,860 847,911 233,972 706,357
Proceeds from disposal of property, plant and
equipment 183,709 395,762 153,040 329,692
11,702,454 14,860,459 9,748,795 12,379,589
Cash outflows from investing activities:
Purchase of short-term financial instruments (6,318,491) (3,929,209) (5,263,654) (3,273,250)
Acquisition of marketable securities (6,271,525) (8,825,279) (5,224,529) (7,351,949)
Additions to other current assets (42,308) (864,293) (35,245) (720,004)
Acquisition of investments (821,821) (1,389,858) (684,623) (1,157,829)
Additions to other assets (222,059) (580,125) (184,988) (483,276)
Acquisition of property, plant and equipment (1,686,611) (1,984,248) (1,405,040) (1,652,989)
Expenditures for development costs (291,690) (976,785) (242,994) (813,716)
(15,654,505) (18,549,797) (13,041,073) (15,453,013)
(3,952,051) (3,689,338) (3,292,278) (3,073,424)
Cash flows from financing activities:
Cash inflows from financing activities:
Proceeds from short-term borrowings 21,315,448 13,078,341 17,756,955 10,894,986
Proceeds from long-term debt 4,993,859 6,604,869 4,160,162 5,502,224
Proceeds from issuance of stock 58,761 150,941 48,951 125,742
Proceeds from disposal of treasury stock 4,931 232,955 4,108 194,064
Others 20,647 240,147 17,200 200,056
26,393,646 20,307,253 21,987,376 16,917,072
Cash outflows from financing activities:
Repayment of short-term borrowings (20,629,745) (10,829,451) (17,185,726) (9,021,535)
Payment of current maturities of long-term debt (2,768,331) (2,583,982) (2,306,174) (2,152,601)
Payment of cash dividends (276,089) (167,653) (229,998) (139,664)
Repayment of long-term debt (1,916,307) (1,533,881) (1,596,390) (1,277,809)
Purchase of treasury stock (20,215) (352,672) (16,840) (293,795)
Others (125,460) (455,382) (104,515) (379,359)
(25,736,147) (15,923,021) (21,439,643) (13,264,763)
657,499 4,384,232 $547,733 $3,652,309
Increase in cash due to the merger (63) - $ (52) $ -
Effect of exchange rate on cash (27,028) 16,193 (22,516) 13,490
Effect of change in consolidated subsidiaries 55,353 26,169 46,112 21,800
Net increase in cash and cash equivalents 461,448 1,594,919 384,412 1,328,656
Cash and cash equivalents, beginning of year 2,304,424 709,505 1,919,713 591,057
Cash and cash equivalents, end of year 2,765,872 2,304,424 $2,304,125 $1,919,713
See accompanying notes to consolidated financial statements
54


