Huntington National Bank 2013 Annual Report Download - page 15
Download and view the complete annual report
Please find page 15 of the 2013 Huntington National Bank annual report below. You can navigate through the pages in the report by either clicking on the pages listed below, or by using the keyword search tool below to find specific information within the annual report.-
 1
1 -
2
-
3
-
4
-
 5
5 -
 6
6 -
 7
7 -
 8
8 -
 9
9 -
 10
10 -
 11
11 -
 12
12 -
 13
13 -
 14
14 -
 15
15 -
 16
16 -
 17
17 -
 18
18 -
 19
19 -
 20
20 -
 21
21 -
 22
22 -
 23
23 -
 24
24 -
 25
25 -
26
-
27
-
28
-
29
-
30
-
31
-
32
-
33
-
34
-
35
-
36
-
37
-
38
-
39
-
40
-
41
-
42
-
43
-
44
-
45
-
46
-
47
-
48
-
49
-
50
-
51
-
52
-
53
-
54
-
55
-
56
-
57
-
58
-
59
-
60
-
61
-
62
-
63
-
64
-
65
-
66
-
67
-
68
-
69
-
70
-
71
-
72
-
73
-
74
-
75
-
76
-
77
-
78
-
79
-
80
-
81
-
82
-
83
-
84
-
85
-
86
-
87
-
88
-
89
-
90
-
91
-
92
-
93
-
94
-
95
-
96
-
97
-
98
-
99
-
100
-
101
-
102
-
103
-
104
-
105
-
106
-
107
-
108
-
109
-
110
-
111
-
112
-
113
-
114
-
115
-
116
-
117
-
118
-
119
-
120
-
121
-
122
-
123
-
124
-
125
-
126
-
127
-
128
-
129
-
130
-
131
-
132
-
133
-
134
-
135
-
136
-
137
-
138
-
139
-
140
-
141
-
142
-
143
-
144
-
145
-
146
-
147
-
148
-
149
-
150
-
151
-
152
-
153
-
154
-
155
-
156
-
157
-
158
-
159
-
160
-
161
-
162
-
163
-
164
-
165
-
166
-
167
-
168
-
169
-
170
-
171
-
172
-
173
-
174
-
175
-
176
-
177
-
178
-
179
-
180
-
181
-
182
-
183
-
184
-
185
-
186
-
187
-
188
-
189
-
190
-
191
-
192
-
193
-
194
-
195
-
196
-
197
-
198
-
199
-
200
-
201
-
202
-
203
-
204
 |
 |

9
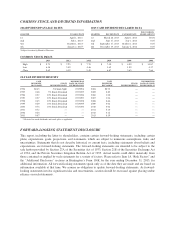
The financial results for each of these business segments are included in Note 25 of Notes to Consolidated Financial Statements
and are discussed in the Business Segment Discussion of our MD&A. We recently announced a reorganization among our executive
leadership team, which will become effective during the 2014 first quarter. As a result, management is currently evaluating the
business segment structure which will impact how we monitor future results and assess performance.
Competition
We compete with other banks and financial services companies such as savings and loans, credit unions, and finance and trust
companies, as well as mortgage banking companies, automobile and equipment financing companies (including captive automobile
finance companies), insurance companies, mutual funds, investment advisors, and brokerage firms, both within and outside of our
primary market areas. Internet companies are also providing nontraditional, but increasingly strong, competition for our borrowers,
depositors, and other customers.
We compete for loans primarily on the basis of a combination of value and service by building customer relationships as a result
of addressing our customers’ entire suite of banking needs, demonstrating expertise, and providing convenience to our customers. We
also consider the competitive pricing pressures in each of our markets.
We compete for deposits similarly on a basis of a combination of value and service and by providing convenience through a
banking network of branches and ATMs within our markets and our website at www.huntington.com. We have also instituted
customer friendly practices, such as our 24-Hour Grace® account feature, which gives customers an additional business day to cover
overdrafts to their consumer account without being charged overdraft fees.
The table below shows our competitive ranking and market share based on deposits of FDIC-insured institutions as of June 30,
2013, in the top 10 metropolitan statistical areas (MSA) in which we compete:
MSA Rank
Deposits (in
millions) Market Share
Columbus, OH 1 $14,436 28%
Detroit, MI 7 4,478 5
Cleveland, OH 4 4,261 8
Indianapolis, IN 4 2,859 8
Pittsburgh, PA 8 2,512 3
Cincinnati, OH 4 2,109 3
Youngstown, OH 1 2,082 23
Toledo, OH 2 2,045 22
Grand Rapids, MI 3 1,855 11
Canton, OH 2 1,494 25
Source: FDIC.gov, based on June 30, 2013 survey.
Many of our nonfinancial institution competitors have fewer regulatory constraints, broader geographic service areas, greater
capital, and, in some cases, lower cost structures. In addition, competition for quality customers has intensified as a result of changes
in regulation, advances in technology and product delivery systems, consolidation among financial service providers, bank failures,
and the conversion of certain former investment banks to bank holding companies.
Regulatory Matters
We are subject to regulation by the SEC, the Federal Reserve, the OCC, the CFPB, and other federal and state regulators.
Because we are a public company, we are subject to regulation by the SEC. The SEC has established five categories of issuers for
the purpose of filing periodic and annual reports. Under these regulations, we are considered to be a large accelerated filer and, as
such, must comply with SEC accelerated reporting requirements.