Huntington National Bank 2009 Annual Report Download - page 3
Download and view the complete annual report
Please find page 3 of the 2009 Huntington National Bank annual report below. You can navigate through the pages in the report by either clicking on the pages listed below, or by using the keyword search tool below to find specific information within the annual report.
T
OO
UR
S
HAREH
O
LDER
S
AND FRIEND
S,
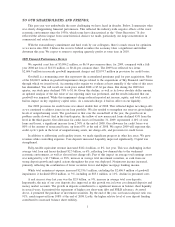
This past
y
ear was undoubtedl
y
the most challen
g
in
g
we have faced in decades. Below, I summarize wha
t
was clearl
y
disappointin
g
financial performance. This reflected the industr
y
-wide ne
g
ative effects of the wors
t
econom
i
cenv
i
ronment s
i
nce t
h
e 1930s
,
w
hi
c
h
some
h
ave c
h
aracter
i
ze
d
as t
h
e “Great Recess
i
on.” It a
l
s
o
reflected the adverse impact from some historical choices we made, particularl
y
our lar
g
e concentration i
n
commercial real estate loans
.
With the extraordinar
y
commitment and hard work b
y
our collea
g
ues, there is much reason for optimis
m
as we move
i
nto 2010. I
b
e
li
eve t
h
e worst
i
s
b
e
hi
n
d
us un
l
ess t
h
e econom
y
ta
k
es a s
ig
n
ifi
cant an
df
urt
h
e
r
d
ownturn t
hi
s
y
ear. We expect to return to report
i
n
g
quarter
ly
pro
fi
ts at some t
i
me
i
n 2010.
2009 F
i
n
a
n
cia
lP
e
r
fo
rm
a
n
ce
R
eview
We reported a net loss of
$
3,094.2 million, or
$
6.14 per common share, for 2009, compared with a full
-
y
ear 2008 net loss of
$
113.8 million, or
$
0.44 per common share. The 2009 loss reflected two items
:
$2,606.9 million in noncash
g
oodwill impairment char
g
es and $2,074.7 million in provision for credit losses
.
Goo
d
w
ill i
s a nonearn
i
n
g
asset t
h
at represents t
h
e accumu
l
ate
d
prem
i
ums pa
id f
or past acqu
i
s
i
t
i
ons. Most
of the $2,606.9 million in
g
oodwill impairment char
g
es related to the acquisitions of Sk
y
Financial and Uniza
n
t
h
roug
h
w
hi
c
h
we
i
ssue
d
stoc
k
. Account
i
ng ru
l
es requ
i
re we eva
l
uate at
l
east annua
ll
y
if
t
h
eva
l
ue o
f
t
hi
s asset
has diminished. You will recall our stock price ended 2008 at
$
7.66 per share. But durin
g
the 2009 first
q
uarter, our stock
p
rice declined 78% to $1.66. Given this decline, as well as its lower absolute dollar amount
,
an updated anal
y
sis of the fair value of our reportin
g
units was performed, and the results indicated that ou
r
g
oo
d
w
ill
was
i
mpa
i
re
d
.W
hil
et
hi
s
i
mpa
i
rment c
h
ar
g
ere
d
uce
d
reporte
d
net
i
ncome, equ
i
t
y
,an
d
tota
l
assets,
it
h
a
d
no
i
mpact on
k
e
y
re
g
u
l
ator
y
cap
i
ta
l
rat
i
os. As a noncas
h
c
h
ar
g
e,
i
t
h
a
d
no a
ff
ect on our
li
qu
idi
t
y.
Our 2009 prov
i
s
i
on
f
or cre
di
t
l
osses was a
l
most
d
ou
bl
et
h
at o
f
2008. T
hi
sre
fl
ecte
d high
er net c
h
ar
g
e-o
ffs
as we continued to address issues in our loan portfolio. We also needed to stren
g
then our reserves
g
iven hi
g
her
levels of nonperformin
g
assets. The
g
ood news is that over the second half of the
y
ear, the
g
rowth rate i
n
p
roblem credits slowed. And in the fourth
q
uarter, the inflow of new nonaccrual loans declined 4
5
% from th
e
level in the third
q
uarter. Our allowance for credit losses at December 31, 2009, re
p
resented 4.1
6
% of tota
l
loans and leases, a si
g
nificant increase from 2.30% at the end of 2008. Our allowance for credit losses wa
s
8
0% of the amount of nonaccrual loans, up from
6
3% at the end of 2008. We expect 2009 will represent thi
s
cre
di
tc
y
c
l
e’s pea
ki
nt
h
e
l
eve
l
o
f
nonper
f
orm
i
n
g
assets, net c
h
ar
g
e-o
ff
s, an
d
prov
i
s
i
on
f
or cre
di
t
l
osses
.
In a
ddi
t
i
on to a
dd
ress
i
n
g
cre
di
t qua
li
t
yi
ssues, we ma
d
es
ig
n
ifi
cant pro
g
ress
i
not
h
er
k
e
y
areas. We
g
re
w
revenues w
hil
e contro
lli
n
g
expenses. Core
d
epos
i
ts
i
ncrease
d
.L
i
qu
idi
t
yi
mprove
d
s
ig
n
ifi
cant
ly
. Cap
i
ta
l
wa
s
stren
g
thened
.
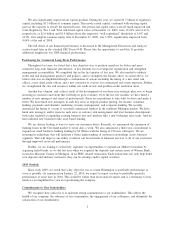
Full
y
-taxable equivalent revenue increased $182.4 million, or 8%, last
y
ear. This was challen
g
in
g
in tha
t
avera
g
e total loan and leases declined $2.3 billion, or 6%, reflectin
g
low demand due to the weakene
d
econom
i
cenv
i
ronment, as we
ll
as e
l
evate
d
net c
h
ar
g
e-o
ff
s. Part o
f
t
hi
s
i
mpact on avera
g
e tota
l
earn
i
n
g
s asset
s
was miti
g
ated b
y
a
$
1.7 billion, or 38%, increase in avera
g
e total investment securities, as cash from ou
r
stron
g
deposit
g
rowth and capital actions throu
g
hout the
y
ear was deplo
y
ed. Noninterest income increased
,
pr
i
mar
ily
re
fl
ect
i
n
g
t
h
e com
bi
nat
i
on o
fl
ower secur
i
t
i
es
l
osses an
d high
er mort
g
a
g
e
b
an
ki
n
gi
ncome.
While total noninterest expense increased $2,556.1 million, excludin
g
the $2,606.9 million of
g
oodwill
impairment, it declined
$
50.8 million, or 3%, includin
g
an
$
83.1 million, or 11%, decline in personnel costs.
A real success stor
y
last
y
ear was the
$
2.9 billion, or 9%, increase in avera
g
e total core deposits
.
Important
ly
,t
h
em
i
xo
f
our core
d
epos
i
ts a
l
so
i
mprove
d
as t
hi
s
g
rowt
h
was
i
n
l
ower cost
d
eman
dd
epos
i
ts an
d
mone
y
market accounts. The
g
rowth in deposits contributed to a si
g
nificant increase in balance sheet liquidit
y
in several wa
y
s. It permitted the repa
y
ment of hi
g
her cost short-term debt and FHLB advances. As noted
a
b
ove,
i
t perm
i
tte
d
t
h
e purc
h
ase o
fi
nvestment secur
i
t
i
es. B
y
t
h
een
d
o
f
t
h
e
y
ear, our
l
oan-to-
d
epos
i
t rat
i
owa
s
91%, muc
hi
mprove
df
rom 108% at t
h
een
d
o
f
2008. Last
ly
,t
h
e
high
er re
l
at
i
ve
l
eve
l
o
f
core
d
epos
i
t
f
un
di
n
g
contributed to increased balance sheet stabilit
y
.
1


