Huntington National Bank 2009 Annual Report Download - page 2
Download and view the complete annual report
Please find page 2 of the 2009 Huntington National Bank annual report below. You can navigate through the pages in the report by either clicking on the pages listed below, or by using the keyword search tool below to find specific information within the annual report.-
 1
1 -
 2
2 -
 3
3 -
 4
4 -
 5
5 -
 6
6 -
 7
7 -
 8
8 -
 9
9 -
 10
10 -
 11
11 -
 12
12 -
 13
13 -
14
-
15
-
16
-
17
-
18
-
19
-
20
-
21
-
22
-
23
-
24
-
25
-
26
-
27
-
28
-
29
-
30
-
31
-
32
-
33
-
34
-
35
-
36
-
37
-
38
-
39
-
40
-
41
-
42
-
43
-
44
-
45
-
46
-
47
-
48
-
49
-
50
-
51
-
52
-
53
-
54
-
55
-
56
-
57
-
58
-
59
-
60
-
61
-
62
-
63
-
64
-
65
-
66
-
67
-
68
-
69
-
70
-
71
-
72
-
73
-
74
-
75
-
76
-
77
-
78
-
79
-
80
-
81
-
82
-
83
-
84
-
85
-
86
-
87
-
88
-
89
-
90
-
91
-
92
-
93
-
94
-
95
-
96
-
97
-
98
-
99
-
100
-
101
-
102
-
103
-
104
-
105
-
106
-
107
-
108
-
109
-
110
-
111
-
112
-
113
-
114
-
115
-
116
-
117
-
118
-
119
-
120
-
121
-
122
-
123
-
124
-
125
-
126
-
127
-
128
-
129
-
130
-
131
-
132
-
133
-
134
-
135
-
136
-
137
-
138
-
139
-
140
-
141
-
142
-
143
-
144
-
145
-
146
-
147
-
148
-
149
-
150
-
151
-
152
-
153
-
154
-
155
-
156
-
157
-
158
-
159
-
160
-
161
-
162
-
163
-
164
-
165
-
166
-
167
-
168
-
169
-
170
-
171
-
172
-
173
-
174
-
175
-
176
-
177
-
178
-
179
-
180
-
181
-
182
-
183
-
184
-
185
-
186
-
187
-
188
-
189
-
190
-
191
-
192
-
193
-
194
-
195
-
196
-
197
-
198
-
199
-
200
-
201
-
202
-
203
-
204
-
205
-
206
-
207
-
208
-
209
-
210
-
211
-
212
-
213
-
214
-
215
-
216
-
217
-
218
-
219
-
220
 |
 |

Huntin
g
ton Bancshares Incorporated (NASDAQ: HBAN) is a $52 billion re
g
ional bank holdin
g
compan
y
headquartered in Columbus, Ohio, and has served the financial needs of its customers for more than 144
y
ears.
Huntin
g
ton’s principal markets are Indiana, Kentuck
y
, Michi
g
an, Ohio, Penns
y
lvania, and West Vir
g
inia. Nearl
y
11,000 co
ll
ea
g
ues prov
id
e consumer an
d
commerc
i
a
lb
an
ki
n
g
, mort
g
a
g
e
b
an
ki
n
g
, automo
bil
e
fi
nanc
i
n
g,
equ
i
pment
l
eas
i
n
g
,
i
nvestment mana
g
ement,
b
ro
k
era
g
e, trust, an
di
nsurance serv
i
ces. Customers
h
ave
convenient access to bankin
g
services throu
g
h more than
6
00 re
g
ional bankin
g
offices, the customer servic
e
call center at (800) 480-BANK (2265), online at www.huntin
g
ton.com, via the technolo
g
icall
y
advanced 24-hou
r
te
l
ep
h
one
b
an
k
,an
d
t
h
rou
gh
Hunt
i
n
g
ton’s networ
k
o
f
over 1,300 ATMs. Non-
b
an
ki
n
gfi
nanc
i
a
l
serv
i
ces ar
e
prov
id
e
d
t
h
rou
gh
se
l
ect
b
an
ki
n
g
o
ffi
ces, as we
ll
as ot
h
er
l
oca
lf
ac
ili
t
i
es.
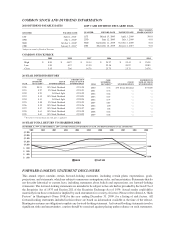
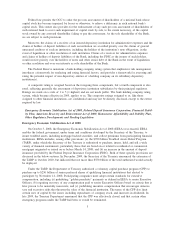
CO
N
SO
LIDATED FINAN
C
IAL HI
G
HLI
G
HT
S
(In millions, exce
p
t
p
er share amounts)
2
009 2008 Chan
ge
NET LOS
S
................................................
$(3
,
094
)
$
(
114
)
$
(
2,980
)
N.M.%
PER COMMON SHARE AMOUNT
S
Net
l
oss
p
er common s
h
are –
dil
ute
d
..............................
.
$(
6.14
)
$(
0.44
)$(
5.70
)
N.M.%
Cash dividend declared per common share . . . . . . . . . . . . . . . . . . . . . . . . . . .
0
.
4000
0.662
5(
0.262
5) (
40
)
T
an
g
ible book value per common shar
e
(1)
...........................
4.21
5
.64
(
1.43
)(
2
5)
PERF
O
RMAN
C
ERATI
OS
Return on avera
g
e total assets. . . . . . . . . . . . . . . . . . . . . . . . . . . . . . . . . . . .
(
5.90
)
%
(
0.21
)
%
(
5.69
)%
Return on average total shareholders’ equity . . . . . . . . . . . . . . . . . . . . . . . . .
(
53.5
)
(
1.8
)(5
1.7
)
Net interest margin
(2)
.........................................
3
.
11
3.2
5(
0.14
)
Efficienc
y
rati
o
(3)
g
g
............................................
55
.4
5
7.0
(
1.6
)
C
APITAL RATIOS
Tier 1 risk-based capital ratio
(1)
..................................
12.0
3%
10
.7
2% 1
.
31%
Tota
l
r
i
s
k
-
b
ase
d
ca
pi
ta
l
rat
io
(1)
...................................
14
.
41
13.
9
10.
50
Tan
gibl
e equ
i
t
y
/tan
gibl
e assets rat
io
(1)(4)
............................
9.24
7
.72 1.
52
Tan
g
ible common equit
y
/tan
g
ible asset ratio
(
1
)(
5
)
......................
5.92
4
.
0
41.
88
CREDIT
Q
UALITY MEASURES
Net c
h
ar
g
e-o
ff
s (NCOs) . . . . . . . . . . . . . . . . . . . . . . . . . . . . . . . . . . . . . . .
.
$
1
,
47
7
$
758
$
719 95%
NCOs as a % of average loans and leases . . . . . . . . . . . . . . . . . . . . . . . . . . .
3
.82
%
1.8
5
% 1.97
%
Nonaccrual loans
(
NALs
)
(1)
.....................................
$
1
,
917 $1
,
502 $ 415 2
8
NAL rat
i
o
(1)(6)
..............................................
5
.21
%
3.66% 1.
55
%
Nonperforming assets (NPAs)
(
1
)
..................................
$
2
,
05
8
$1
,
637 $ 421 2
6
NPA rat
io
(1)(7)
g
...............................................
5
.57
%
3.
9
7% 1.
6
0
%
Allowance for credit losses
(
ACL
)
(
1
)
...............................
$
1
,
53
1
$
944
$
587 6
2
AC
Lasa%o
f
tota
ll
oans an
dl
eases
(1)
.............................
4.16
%
2
.
30
%1.
86%
AC
Lasa%ofNAL
s
(1)
........................................
80
63
1
7
BALANCE
S
HEET – DECEMBER 31
,
Tota
ll
oans an
dl
eases........................................
.
$
36
,
79
1
$
41,092
$(
4,301
)(
10
)%
Total assets
................................................
5
1,
555
5
4,3
5
3
(
2,798
) (5)
Tota
ld
e
p
os
i
ts...............................................
40
,
494
37
,
943 2
,55
17
Tota
l
s
h
are
h
o
ld
ers’ equ
i
t
y
......................................
5,336
7,229
(
1,893
)(
2
6)
N.M., not a mean
i
n
gf
u
l
va
l
ue.
(1
)
At Decem
b
er
3
1
.
(2)
On a full
y
-taxable equivalent (FTE) basis assumin
g
a 35% tax rate
.
(
3
)
Non
i
nterest expense
l
ess amort
i
zat
i
on o
fi
ntan
gibl
es an
dg
oo
d
w
ill i
mpa
i
rment
di
v
id
e
dby
t
h
e sum o
f
FTE net
i
nterest
i
ncome an
d
non
i
nterest
i
ncome exc
l
u
di
ng secur
i
t
i
es
l
osses
.
(4
)
Tan
g
ible equit
y
(total equit
y
less
g
oodwill and other intan
g
ible assets) divided b
y
tan
g
ible assets (total assets less
g
oodwill and othe
r
intan
g
ible assets). Other intan
g
ible assets are net of deferred tax
.
(
5)
Tan
g
ible common equit
y
(total common equit
y
less
g
oodwill and other intan
g
ible assets) divided b
y
tan
g
ible assets (total assets les
s
g
oodwill and other intan
g
ible assets). Other intan
g
ible assets are net of deferred tax
.
(6
)
NALs
di
v
id
e
dby
tota
ll
oans an
dl
eases
.
(
7
)
NPAs
di
v
id
e
dby
t
h
e sum o
f
tota
ll
oans an
dl
eases,
i
mpa
i
re
dl
oans
h
e
ld
-
f
or-sa
l
e, an
d
net ot
h
er rea
l
estate
.