Hamilton Beach 2012 Annual Report Download - page 8
Download and view the complete annual report
Please find page 8 of the 2012 Hamilton Beach annual report below. You can navigate through the pages in the report by either clicking on the pages listed below, or by using the keyword search tool below to find specific information within the annual report.-
 1
1 -
 2
2 -
 3
3 -
 4
4 -
 5
5 -
 6
6 -
 7
7 -
 8
8 -
 9
9 -
 10
10 -
 11
11 -
 12
12 -
 13
13 -
 14
14 -
 15
15 -
 16
16 -
 17
17 -
 18
18 -
 19
19 -
20
-
21
-
22
-
23
-
24
-
25
-
26
-
27
-
28
-
29
 |
 |

6
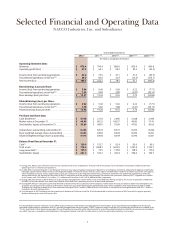
Year Ended December 31
2012(1) 2011(1)(2) 2010(1)(2) 2009(1)(2)(3) 2008(1)(2)(3)(4)
(In millions, except per share data)
Operating Statement Data:
Revenues . . . . . . . . . . . . . . . . . . . . . . . . . . . . . . . . . . . . . . . . . . . . . . .
Operating profit (loss) . . . . . . . . . . . . . . . . . . . . . . . . . . . . . . . . . .
Income (loss) from continuing operations . . . . . . . . . . . . . .
Discontinued operations, net-of-tax(1)(3). . . . . . . . . . . . . . . . . .
Net income (loss) . . . . . . . . . . . . . . . . . . . . . . . . . . . . . . . . . . . . . . .
Basic Earnings (Loss) per Share:
Income (loss) from continuing operations . . . . . . . . . . . . . .
Discontinued operations, net-of-tax(1)(3). . . . . . . . . . . . . . . . . .
Basic earnings (loss) per share . . . . . . . . . . . . . . . . . . . . . . . . . .
Diluted Earnings (Loss) per Share:
Income (loss) from continuing operations . . . . . . . . . . . . . .
Discontinued operations, net-of-tax(1)(3). . . . . . . . . . . . . . . . . .
Diluted earnings (loss) per share . . . . . . . . . . . . . . . . . . . . . . . .
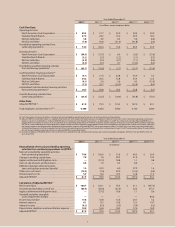
Per Share and Share Data:
Cash dividends(5). . . . . . . . . . . . . . . . . . . . . . . . . . . . . . . . . . . . . . . .
Market value at December 31. . . . . . . . . . . . . . . . . . . . . . . . . . .
Stockholders’ equity at December 31. . . . . . . . . . . . . . . . . . .
Actual shares outstanding at December 31. . . . . . . . . . . . .
Basic weighted average shares outstanding . . . . . . . . . . . .
Diluted weighted average shares outstanding . . . . . . . . . .
Balance Sheet Data at December 31:
Cash(1).. . . . . . . . . . . . . . . . . . . . . . . . . . . . . . . . . . . . . . . . . . . . . . . . .
Total assets . . . . . . . . . . . . . . . . . . . . . . . . . . . . . . . . . . . . . . . . . . . . .
Long-term debt(1). . . . . . . . . . . . . . . . . . . . . . . . . . . . . . . . . . . . . . .
Stockholders’ equity . . . . . . . . . . . . . . . . . . . . . . . . . . . . . . . . . . . .
$ 790.4
$ 64.1
$ 79.5
82.6
$ 162.1
$ 9.49
9.85
$ 19.34
$ 9.46
9.82
$ 19.28
$ 2.120
$ 89.22
$ 68.81
8.374
8.383
8.408
$ 153.7
$ 1,808.7
$ 74.5
$ 576.2
(1) During 2012, NACCO spun off Hyster-Yale, a former subsidiary. The results of operations of Hyster-Yale for all periods shown have been reclassified to reflect Hyster-Yale’s
operating results as discontinued operations.
(2) In 2006, NACCO initiated litigation in the Delaware Chancery Court against Applica Incorporated (“Applica”) and individuals and entities affiliated with Applica’s shareholder,
Harbinger Capital Partners Master Fund, Ltd. The litigation alleged a number of contract and tort claims against the defendants related to the failed transaction with Applica,
which had been previously announced. On February 14, 2011, the parties to this litigation entered into a settlement agreement. The settlement agreement provided for,
among other things, the payment of $60 million to NACCO and dismissal of the lawsuit with prejudice. The payment was received in February 2011. Litigation costs related
to this matter were $2.8 million, $18.8 million, $1.1 million and $0.8 million in 2011, 2010, 2009 and 2008, respectively.
(3) During 2009, the Company’s North American Coal subsidiary completed the sale of certain assets of the Red River Mining Company. The results of operations of Red River
for 2009 and all prior periods have been reclassified to reflect Red River’s operating results as discontinued operations.
(4) During 2008, NACCO’s stock price significantly declined compared with previous periods and the Company’s market value of equity was below its book value of tangible assets
and book value of equity. The Company performed an impairment test, which indicated that goodwill and certain other intangibles were impaired at December 31, 2008.
Therefore, the Company recorded a non-cash impairment charge of $435.7 million in 2008, of which $84.6 million is included in continuing operations and $351.1 million is
included in discontinued operations.
(5) Cash dividends in 2012 include a one-time special cash dividend of $3.50 per share. The $0.25 dividend paid in the fourth quarter of 2012 was the first regular quarterly
dividend following the spin off of Hyster-Yale.
$ 873.4
$ 67.5
$ 42.2
66.5
$ 108.7
$ 5.04
7.93
$ 12.97
$ 5.02
7.90
$ 12.92
$ 5.378
$ 60.69
$ 33.69
8.353
8.384
8.414
$ 139.9
$ 776.3
$ 135.4
$ 281.4
Selected Financial and Operating Data
NACCO Industries, Inc. and Subsidiaries
This Annual Report contains references to non-GAAP financial measures. Presentations of, and quantitative reconciliations to, the most directly comparable financial measures
calculated and presented in accordance with U.S. generally accepted accounting principles (“GAAP”) appear on page 7 and page 24. For certain pre-tax disclosures included in the
“To Our Stockholders” letter beginning on page 8, the resulting after-tax amount and the related income tax amount have been included. Certain after-tax amounts are considered
non-GAAP measures in accordance with Regulation G. Management believes that after-tax information is useful in analyzing the Company’s net income.
$ 885.6
$ 94.2
$ 47.1
32.4
$ 79.5
$ 5.66
3.89
$ 9.55
$ 5.65
3.88
$ 9.53
$ 2.085
$ 108.37
$ 53.69
8.333
8.328
8.344
$ 92.4
$ 1,670.9
$ 139.8
$ 447.4
$ 835.4
$ 90.3
$ 51.6
(20.5)
$ 31.1
$ 6.22
(2.47)
$ 3.75
$ 6.22
(2.47)
$ 3.75
$ 2.068
$ 49.80
$ 47.82
8.294
8.290
8.296
$ 93.0
$ 1,497.4
$ 148.4
$ 396.6
$ 840.8
$ (45.5)
$ (63.9)
(373.7)
$ (437.6)
$ (7.71)
(45.13)
$ (52.84)
$ (7.71)
(45.13)
$ (52.84)
$ 2.045
$ 37.41
$ 43.05
8.286
8.281
8.281
$ 80.2
$ 1,702.3
$ 170.6
$ 356.7