HCA Holdings 2012 Annual Report Download - page 9
Download and view the complete annual report
Please find page 9 of the 2012 HCA Holdings annual report below. You can navigate through the pages in the report by either clicking on the pages listed below, or by using the keyword search tool below to find specific information within the annual report.
Our hospitals do not typically engage in extensive medical research and education programs. However,
some of our hospitals are affiliated with medical schools and may participate in the clinical rotation of medical
interns and residents and other education programs.
At December 31, 2012, we operated five psychiatric hospitals with 506 licensed beds. Our psychiatric
hospitals provide therapeutic programs including child, adolescent and adult psychiatric care, adult and
adolescent alcohol and drug abuse treatment and counseling.
We also operate outpatient health care facilities which include freestanding ambulatory surgery centers
(“ASCs”), freestanding emergency care facilities, diagnostic and imaging centers, comprehensive outpatient
rehabilitation and physical therapy centers, outpatient radiation and oncology therapy centers and various other
facilities. These outpatient services are an integral component of our strategy to develop comprehensive health
care networks in select communities. Most of our ASCs are operated through partnerships or limited liability
companies, with majority ownership of each partnership or limited liability company typically held by a general
partner or subsidiary that is an affiliate of HCA.
Certain of our affiliates provide a variety of management services to our health care facilities, including
patient safety programs; ethics and compliance programs; national supply contracts; equipment purchasing and
leasing contracts; accounting, financial and clinical systems; governmental reimbursement assistance;
construction planning and coordination; information technology systems and solutions; legal counsel; human
resources services; and internal audit services.
Sources of Revenue
Hospital revenues depend upon inpatient occupancy levels, the medical and ancillary services ordered by
physicians and provided to patients, the volume of outpatient procedures and the charges or payment rates for
such services. Charges and reimbursement rates for inpatient services vary significantly depending on the type of
payer, the type of service (e.g., medical/surgical, intensive care or psychiatric) and the geographic location of the
hospital. Inpatient occupancy levels fluctuate for various reasons, many of which are beyond our control.
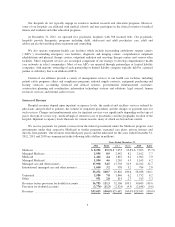
We receive payments for patient services from the federal government under the Medicare program, state
governments under their respective Medicaid or similar programs, managed care plans, private insurers and
directly from patients. Our revenues from third-party payers and the uninsured for the years ended December 31,
2012, 2011 and 2010 are summarized in the following table (dollars in millions):
Years Ended December 31,
2012 Ratio 2011 Ratio 2010 Ratio
Medicare ...................................... $ 8,292 25.1%$ 7,653 25.8% $ 7,203 25.7%
Managed Medicare .............................. 2,954 8.9 2,442 8.2 2,162 7.7
Medicaid ...................................... 1,464 4.4 1,845 6.2 1,962 7.0
Managed Medicaid .............................. 1,504 4.6 1,265 4.3 1,165 4.2
Managed care and other insurers .................... 17,998 54.5 15,703 52.9 14,762 52.7
International (managed care and other insurers) ........ 1,060 3.2 938 3.2 784 2.8
33,272 100.7 29,846 100.6 28,038 100.1
Uninsured ..................................... 2,580 7.8 1,846 6.2 1,732 6.2
Other ......................................... 931 2.8 814 2.7 913 3.3
Revenues before provision for doubtful accounts ....... 36,783 111.3 32,506 109.5 30,683 109.6
Provision for doubtful accounts .................... (3,770) (11.3) (2,824) (9.5) (2,648) (9.6)
Revenues ...................................... $33,013 100.0%$29,682 100.0% $28,035 100.0%
5

