HCA Holdings 2012 Annual Report Download - page 4
Download and view the complete annual report
Please find page 4 of the 2012 HCA Holdings annual report below. You can navigate through the pages in the report by either clicking on the pages listed below, or by using the keyword search tool below to find specific information within the annual report.-
 1
1 -
 2
2 -
 3
3 -
 4
4 -
 5
5 -
 6
6 -
 7
7 -
 8
8 -
 9
9 -
 10
10 -
 11
11 -
 12
12 -
 13
13 -
 14
14 -
 15
15 -
16
-
17
-
18
-
19
-
20
-
21
-
22
-
23
-
24
-
25
-
26
-
27
-
28
-
29
-
30
-
31
-
32
-
33
-
34
-
35
-
36
-
37
-
38
-
39
-
40
-
41
-
42
-
43
-
44
-
45
-
46
-
47
-
48
-
49
-
50
-
51
-
52
-
53
-
54
-
55
-
56
-
57
-
58
-
59
-
60
-
61
-
62
-
63
-
64
-
65
-
66
-
67
-
68
-
69
-
70
-
71
-
72
-
73
-
74
-
75
-
76
-
77
-
78
-
79
-
80
-
81
-
82
-
83
-
84
-
85
-
86
-
87
-
88
-
89
-
90
-
91
-
92
-
93
-
94
-
95
-
96
-
97
-
98
-
99
-
100
-
101
-
102
-
103
-
104
-
105
-
106
-
107
-
108
-
109
-
110
-
111
-
112
-
113
-
114
-
115
-
116
-
117
-
118
-
119
-
120
-
121
-
122
-
123
-
124
-
125
-
126
-
127
-
128
-
129
-
130
-
131
-
132
-
133
-
134
-
135
-
136
-
137
-
138
-
139
-
140
-
141
-
142
-
143
-
144
-
145
-
146
-
147
-
148
-
149
-
150
-
151
-
152
-
153
-
154
-
155
-
156
-
157
-
158
-
159
-
160
-
161
 |
 |

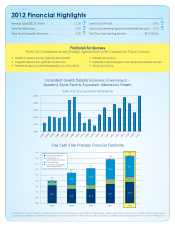
Consistent Growth Despite Economic Environment –
Quarterly Same Facility Equivalent Admissions Growth
Same Facility Equivalent Admissions
Revenues Totaled $33.013 Billion .......................11.2%
Same Facility Revenues ................................4.5%
Same Facility Equivalent Admissions ......................4.1%
Same Facility ER Visits. . . . . . . . . . . . . . . . . . . . . . . . . . . . . . . . .8.6%
Same Facility Operating Expenses per Equivalent Admission ...0.7%
Cash Flows from Operating Activities ..............$4.175 Billion
2012 Financial Highlights
Free Cash Flow Provides Financial Flexibility
1Q08
2Q08
3Q08
4Q08
5.0%
4.0%
3.0%
2.0%
1.0%
0.0%
1Q09
2Q09
3Q09
4Q09
1Q10
2Q10
3Q10
4Q10
1Q11
2Q11
3Q11
4Q11
1Q12
2Q12
3Q12
4Q12
$1.6 $1.3 $1.3
$1.7 $1.9
$0.2
$0.3 $0.3
$0.4
$0.4
$0.2
$1.1
$1.5
$1.8
$1.9
$2.0
$2.7
$3.1
$3.9
$4.2
$0.0
$0.5
$1.0
$1.5
$2.0
$2.5
$3.0
$3.5
$4.0
$4.5
2008 2009 2010 2011 2012
Capital Expenditures
Distributions to
Noncontrolling Interests
Free Cash Flow
Cash Flows Provided by
Operating Activities
Positioned for Success
HCA’s Core Competencies and Strategic Agenda Position the Company for Future Success
• Portfolio of assets in growing, highly attractive markets
• Integrated networks with significant market share
• Flexibility to approach market incrementally across the portfolio
• Efficient cost structure
• Investment in key technologies to drive clinical and operational outcomes
• Strong free cash flow
The terms “HCA” or the “Company” as used in this report refer to HCA Holdings, Inc. and its afliates, unless otherwise stated or indicated by context. The term “facilities” refers to entities owned
or operated by subsidiaries or afliates of HCA Holdings, Inc. References herein to “HCA employees” refer to employees or afliates of HCA Management Services, LP or HCA Holdings, Inc.