Fujitsu 2003 Annual Report Download - page 3
Download and view the complete annual report
Please find page 3 of the 2003 Fujitsu annual report below. You can navigate through the pages in the report by either clicking on the pages listed below, or by using the keyword search tool below to find specific information within the annual report.-
 1
1 -
 2
2 -
 3
3 -
 4
4 -
 5
5 -
 6
6 -
 7
7 -
 8
8 -
 9
9 -
 10
10 -
 11
11 -
 12
12 -
 13
13 -
 14
14 -
15
-
16
-
17
-
18
-
19
-
20
-
21
-
22
-
23
-
24
-
25
-
26
-
27
-
28
-
29
-
30
-
31
-
32
-
33
-
34
-
35
-
36
-
37
-
38
-
39
-
40
-
41
-
42
-
43
-
44
-
45
-
46
-
47
-
48
-
49
-
50
-
51
-
52
-
53
-
54
-
55
-
56
 |
 |

1
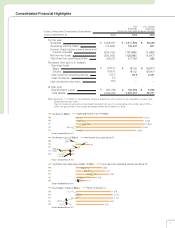
Fujitsu Limited and Consolidated Subsidiaries
Years ended March 31
¥ 5,006,977
(74,426)
(594,733)
(382,542)
306,571
2002 2003 2003
Yen
(millions)
(
except per share data
)
U.S. Dollars
(
millions
)
(
except per share data
)
For the year:
¥(193.0)
(193.0)
154.7
5.0
10%
Note: See Note 17 of Notes to Consolidated Financial Statements with respect to the calculation of basic and
diluted earnings per share.
The U.S. dollar amounts above have been translated from yen, for convenience only, at the rate of ¥120 =
US$1, the approximate Tokyo foreign exchange market rate on March 31, 2003.
¥ 853,756
4,595,804
¥ 4,617,580
100,427
(147,606)
(122,066)
117,797
¥(61.3)
(61.3)
58.9
―
―
¥ 702,390
4,225,361
$ 38,480
837
(
1,230
)
(
1,017
)
982
$
(
0.511
)
(
0.511
)
0.491
―
―
$ 5,853
35,211
Consolidated Financial Highlights
Per share (Yen and U.S. dollars):
Shareholders' equity
Total assets
Earnings (loss)
Basic
Diluted
Cash flows from operating activities
Cash dividends
Cash dividends to face value
Net sales
Operating income (loss)
Income (loss) before income taxes and
minority interests
Net income (loss)
Cash flows from operating activities
At year-end: