Freddie Mac 2011 Annual Report Download - page 9
Download and view the complete annual report
Please find page 9 of the 2011 Freddie Mac annual report below. You can navigate through the pages in the report by either clicking on the pages listed below, or by using the keyword search tool below to find specific information within the annual report.-
 1
1 -
 2
2 -
 3
3 -
 4
4 -
 5
5 -
 6
6 -
 7
7 -
 8
8 -
 9
9 -
 10
10 -
 11
11 -
 12
12 -
 13
13 -
 14
14 -
 15
15 -
 16
16 -
 17
17 -
 18
18 -
 19
19 -
 20
20 -
21
-
22
-
23
-
24
-
25
-
26
-
27
-
28
-
29
-
30
-
31
-
32
-
33
-
34
-
35
-
36
-
37
-
38
-
39
-
40
-
41
-
42
-
43
-
44
-
45
-
46
-
47
-
48
-
49
-
50
-
51
-
52
-
53
-
54
-
55
-
56
-
57
-
58
-
59
-
60
-
61
-
62
-
63
-
64
-
65
-
66
-
67
-
68
-
69
-
70
-
71
-
72
-
73
-
74
-
75
-
76
-
77
-
78
-
79
-
80
-
81
-
82
-
83
-
84
-
85
-
86
-
87
-
88
-
89
-
90
-
91
-
92
-
93
-
94
-
95
-
96
-
97
-
98
-
99
-
100
-
101
-
102
-
103
-
104
-
105
-
106
-
107
-
108
-
109
-
110
-
111
-
112
-
113
-
114
-
115
-
116
-
117
-
118
-
119
-
120
-
121
-
122
-
123
-
124
-
125
-
126
-
127
-
128
-
129
-
130
-
131
-
132
-
133
-
134
-
135
-
136
-
137
-
138
-
139
-
140
-
141
-
142
-
143
-
144
-
145
-
146
-
147
-
148
-
149
-
150
-
151
-
152
-
153
-
154
-
155
-
156
-
157
-
158
-
159
-
160
-
161
-
162
-
163
-
164
-
165
-
166
-
167
-
168
-
169
-
170
-
171
-
172
-
173
-
174
-
175
-
176
-
177
-
178
-
179
-
180
-
181
-
182
-
183
-
184
-
185
-
186
-
187
-
188
-
189
-
190
-
191
-
192
-
193
-
194
-
195
-
196
-
197
-
198
-
199
-
200
-
201
-
202
-
203
-
204
-
205
-
206
-
207
-
208
-
209
-
210
-
211
-
212
-
213
-
214
-
215
-
216
-
217
-
218
-
219
-
220
-
221
-
222
-
223
-
224
-
225
-
226
-
227
-
228
-
229
-
230
-
231
-
232
-
233
-
234
-
235
-
236
-
237
-
238
-
239
-
240
-
241
-
242
-
243
-
244
-
245
-
246
-
247
-
248
-
249
-
250
-
251
-
252
-
253
-
254
-
255
-
256
-
257
-
258
-
259
-
260
-
261
-
262
-
263
-
264
-
265
-
266
-
267
-
268
-
269
-
270
-
271
-
272
-
273
-
274
-
275
-
276
-
277
-
278
-
279
-
280
-
281
-
282
-
283
-
284
-
285
-
286
-
287
-
288
-
289
-
290
-
291
-
292
-
293
-
294
-
295
-
296
-
297
-
298
-
299
-
300
-
301
-
302
-
303
-
304
-
305
-
306
-
307
-
308
-
309
-
310
-
311
-
312
-
313
-
314
-
315
-
316
-
317
-
318
-
319
-
320
-
321
-
322
-
323
-
324
-
325
-
326
-
327
-
328
-
329
-
330
-
331
-
332
-
333
-
334
-
335
-
336
-
337
-
338
-
339
-
340
-
341
-
342
-
343
-
344
-
345
-
346
-
347
-
348
-
349
-
350
-
351
-
352
-
353
-
354
-
355
-
356
-
357
-
358
-
359
-
360
-
361
-
362
-
363
-
364
-
365
-
366
-
367
-
368
-
369
-
370
-
371
-
372
-
373
-
374
-
375
-
376
-
377
-
378
-
379
-
380
-
381
-
382
-
383
-
384
-
385
-
386
-
387
-
388
-
389
-
390
-
391
-
392
-
393
 |
 |

mortgage funds. We estimate that, for 20 years prior to 2007, the average effective interest rates on conforming, fixed-rate
single-family mortgage loans were about 30 basis points lower than on non-conforming loans. Since 2007, we estimate
that, at times, interest rates on conforming, fixed-rate loans, excluding conforming jumbo loans, have been lower than
those on non-conforming loans by as much as 184 basis points. In December 2011, we estimate that borrowers were
paying an average of 56 basis points less on these conforming loans than on non-conforming loans. These estimates are
based on data provided by HSH Associates, a third-party provider of mortgage market data. Future increases in our
management and guarantee fee rates, such as those required under the recently enacted Temporary Payroll Tax Cut
Continuation Act of 2011, may reduce the difference in rates between conforming and non-conforming loans over time.
For more information, see “Regulation and Supervision — Legislative and Regulatory Developments — Legislated
Increase to Guarantee Fees.”
Reducing Foreclosures and Keeping Families in Homes
We are focused on reducing the number of foreclosures and helping to keep families in their homes. In addition to
our participation in HAMP, we introduced several new initiatives during the last few years to help eligible borrowers keep
their homes or avoid foreclosure, including our relief refinance mortgage initiative. During 2011 and 2010, we helped
more than 208,000 and 275,000 borrowers, respectively, either stay in their homes or sell their properties and avoid
foreclosure through HAMP and our various other workout initiatives.
On April 28, 2011, FHFA announced a new set of aligned standards for servicing non-performing loans owned or
guaranteed by Freddie Mac and Fannie Mae. The servicing alignment initiative provides for consistent ongoing processes
for non-HAMP loan modifications. We implemented most aspects of this initiative in 2011. We believe that the servicing
alignment initiative will ultimately change, among other things, the way servicers communicate and work with troubled
borrowers, bring greater consistency and accountability to the servicing industry, and help more distressed homeowners
avoid foreclosure. For information on changes to mortgage servicing and foreclosure practices that could adversely affect
our business, see “Regulation and Supervision — Legislative and Regulatory Developments — Developments Concerning
Single-Family Servicing Practices.”
In addition to these loan workout initiatives, our relief refinance opportunities, including HARP (which is the portion
of our relief refinance initiative for loans with LTV ratios above 80%), are a significant part of our effort to keep families
in their homes. Relief refinance loans have been provided to more than 480,000 borrowers with LTV ratios above 80%
since the initiative began in 2009, including nearly 185,000 such loans during 2011.
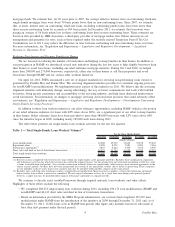
The table below presents our single-family loan workout activities for the last five quarters.
Table 1 — Total Single-Family Loan Workout Volumes
(1)
12/31/2011 09/30/2011 06/30/2011 03/31/2011 12/31/2010
For the Three Months Ended
(number of loans)
Loan modifications . . . . . . . . . . . . . . . . . . . . . . . . . . . . . . . . . . . . . . . . . . 19,048 23,919 31,049 35,158 37,203
Repayment plans . . . . . . . . . . . . . . . . . . . . . . . . . . . . . . . . . . . . . . . . . . . . 8,008 8,333 7,981 9,099 7,964
Forbearance agreements
(2)
. . . . . . . . . . . . . . . . . . . . . . . . . . . . . . . . . . . . . . 3,867 4,262 3,709 7,678 5,945
Short sales and deed in lieu of foreclosure transactions . . . . . . . . . . . . . . . . . . 12,675 11,744 11,038 10,706 12,097
Total single-family loan workouts . . . . . . . . . . . . . . . . . . . . . . . . . . . . . . . . . 43,598 48,258 53,777 62,641 63,209
(1) Based on actions completed with borrowers for loans within our single-family credit guarantee portfolio. Excludes those modification, repayment,
and forbearance activities for which the borrower has started the required process, but the actions have not been made permanent or effective, such
as loans in modification trial periods. Also excludes certain loan workouts where our single-family seller/servicers have executed agreements in the
current or prior periods, but these have not been incorporated into certain of our operational systems, due to delays in processing. These categories
are not mutually exclusive and a loan in one category may also be included within another category in the same period.
(2) Excludes loans with long-term forbearance under a completed loan modification. Many borrowers complete a short-term forbearance agreement
before another loan workout is pursued or completed. We only report forbearance activity for a single loan once during each quarterly period;
however, a single loan may be included under separate forbearance agreements in separate periods.
We continue to directly assist troubled borrowers through targeted outreach, loan workouts, and other efforts.
Highlights of these efforts include the following:
• We completed 208,274 single-family loan workouts during 2011, including 109,174 loan modifications (HAMP and
non-HAMP) and 46,163 short sales and deed in lieu of foreclosure transactions.
• Based on information provided by the MHA Program administrator, our servicers had completed 152,519 loan
modifications under HAMP from the introduction of the initiative in 2009 through December 31, 2011 and, as of
December 31, 2011, 12,802 loans were in HAMP trial periods (this figure only includes borrowers who made at
least their first payment under the trial period).
4Freddie Mac