Freddie Mac 2011 Annual Report Download - page 3
Download and view the complete annual report
Please find page 3 of the 2011 Freddie Mac annual report below. You can navigate through the pages in the report by either clicking on the pages listed below, or by using the keyword search tool below to find specific information within the annual report.
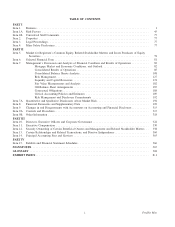
MD&A TABLE REFERENCE
Table Description Page
— Selected Financial Data ............................................................... 81
1 Total Single-Family Loan Workout Volumes ................................................ 4
2 Single-Family Credit Guarantee Portfolio Data by Year of Origination ............................ 7
3 Credit Statistics, Single-Family Credit Guarantee Portfolio ..................................... 8
4 Mortgage-Related Investments Portfolio ................................................... 26
5 Affordable Housing Goals for 2010 and 2011 and Results for 2010 ............................... 35
6 Affordable Housing Goals and Results for 2009 ............................................. 36
7 Quarterly Common Stock Information .................................................... 78
8 Mortgage Market Indicators ............................................................ 82
9 Summary Consolidated Statements of Income and Comprehensive Income ......................... 85
10 Average Balance, Net Interest Income, and Rate/Volume Analysis ................................ 86
11 Net Interest Income .................................................................. 87
12 Derivative Gains (Losses) ............................................................. 91
13 Other Income ...................................................................... 93
14 Non-Interest Expense ................................................................. 94
15 REO Operations Expense, REO Inventory, and REO Dispositions ................................ 95
16 Composition of Segment Mortgage Portfolios and Credit Risk Portfolios ........................... 98
17 Segment Earnings and Key Metrics — Investments ........................................... 99
18 Segment Earnings and Key Metrics — Single-Family Guarantee ................................. 102
19 Segment Earnings Composition — Single-Family Guarantee Segment ............................. 103
20 Segment Earnings and Key Metrics — Multifamily ........................................... 106
21 Investments in Available-For-Sale Securities ................................................ 109
22 Investments in Trading Securities . ....................................................... 109
23 Characteristics of Mortgage-Related Securities on Our Consolidated Balance Sheets .................. 110
24 Additional Characteristics of Mortgage-Related Securities on Our Consolidated Balance Sheets .......... 111
25 Total Mortgage-Related Securities Purchase Activity.......................................... 112
26 Non-Agency Mortgage-Related Securities Backed by Subprime First Lien, Option ARM, and Alt-A Loans
and Certain Related Credit Statistics .................................................... 114
27 Non-Agency Mortgage-Related Securities Backed by Subprime, Option ARM, Alt-A and Other Loans .... 115
28 Net Impairment of Available-For-Sale Mortgage-Related Securities Recognized in Earnings............. 116
29 Ratings of Non-Agency Mortgage-Related Securities Backed by Subprime, Option ARM, Alt-A and Other
Loans, and CMBS ................................................................. 118
30 Mortgage Loan Purchase and Other Guarantee Commitment Activity ............................. 120
31 Derivative Fair Values and Maturities ..................................................... 121
32 Changes in Derivative Fair Values ....................................................... 122
33 Reconciliation of the Par Value and UPB to Total Debt, Net .................................... 123
34 Other Short-Term Debt ............................................................... 124
35 Freddie Mac Mortgage-Related Securities .................................................. 125
36 Freddie Mac Mortgage-Related Securities by Class Type ...................................... 126
37 Issuances and Extinguishments of Debt Securities of Consolidated Trusts .......................... 126
38 Changes in Total Equity (Deficit) . ....................................................... 127
39 Repurchase Request Activity ........................................................... 130
40 Loans Released from Repurchase Obligations ............................................... 131
41 Mortgage Insurance by Counterparty ..................................................... 134
42 Bond Insurance by Counterparty . ....................................................... 135
43 Non-Agency Mortgage-Related Securities Covered by Primary Bond Insurance ...................... 136
44 Derivative Counterparty Credit Exposure .................................................. 138
45 Characteristics of the Single-Family Credit Guarantee Portfolio.................................. 142
46 Single-Family Loans Scheduled Payment Change to Include Principal by Year at December 31, 2011 ..... 145
47 Serious Delinquency Rates by Year of Payment Change to Include Principal ........................ 145
48 Single-Family Scheduled Adjustable-Rate Resets by Year at December 31, 2011 ..................... 146
49 Serious Delinquency Rates by Year of First Rate Reset ........................................ 146
50 Certain Higher-Risk Categories in the Single-Family Credit Guarantee Portfolio ..................... 149
51 Single-Family Home Affordable Modification Program Volume ................................. 153
52 Single-Family Refinance Loan Volume .................................................... 155
53 Single-Family Loan Workouts, Serious Delinquency, and Foreclosures Volumes...................... 157
54 Reperformance Rates of Modified Single-Family Loans ....................................... 158
ii Freddie Mac

