Ford 2014 Annual Report Download - page 11
Download and view the complete annual report
Please find page 11 of the 2014 Ford annual report below. You can navigate through the pages in the report by either clicking on the pages listed below, or by using the keyword search tool below to find specific information within the annual report.-
 1
1 -
 2
2 -
 3
3 -
 4
4 -
 5
5 -
 6
6 -
 7
7 -
 8
8 -
 9
9 -
 10
10 -
 11
11 -
 12
12 -
 13
13 -
 14
14 -
 15
15 -
 16
16 -
 17
17 -
 18
18 -
 19
19 -
 20
20 -
 21
21 -
 22
22 -
23
-
24
-
25
-
26
-
27
-
28
-
29
-
30
-
31
-
32
-
33
-
34
-
35
-
36
-
37
-
38
-
39
-
40
-
41
-
42
-
43
-
44
-
45
-
46
-
47
-
48
-
49
-
50
-
51
-
52
-
53
-
54
-
55
-
56
-
57
-
58
-
59
-
60
-
61
-
62
-
63
-
64
-
65
-
66
-
67
-
68
-
69
-
70
-
71
-
72
-
73
-
74
-
75
-
76
-
77
-
78
-
79
-
80
-
81
-
82
-
83
-
84
-
85
-
86
-
87
-
88
-
89
-
90
-
91
-
92
-
93
-
94
-
95
-
96
-
97
-
98
-
99
-
100
-
101
-
102
-
103
-
104
-
105
-
106
-
107
-
108
-
109
-
110
-
111
-
112
-
113
-
114
-
115
-
116
-
117
-
118
-
119
-
120
-
121
-
122
-
123
-
124
-
125
-
126
-
127
-
128
-
129
-
130
-
131
-
132
-
133
-
134
-
135
-
136
-
137
-
138
-
139
-
140
-
141
-
142
-
143
-
144
-
145
-
146
-
147
-
148
-
149
-
150
-
151
-
152
-
153
-
154
-
155
-
156
-
157
-
158
-
159
-
160
-
161
-
162
-
163
-
164
-
165
-
166
-
167
-
168
-
169
-
170
-
171
-
172
-
173
-
174
-
175
-
176
-
177
-
178
-
179
-
180
-
181
-
182
-
183
-
184
-
185
-
186
-
187
-
188
-
189
-
190
-
191
-
192
-
193
-
194
-
195
-
196
-
197
-
198
-
199
-
200
 |
 |

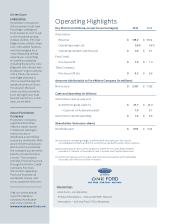
Item 1. Business (Continued)
Industry Sales Volume
Industry sales volume in each region and in certain key markets within each region during the past three years were
as follows (in millions of units):
Industry Sales Volume (a)
2014 2013 2012
United States 16.8 15.9 14.8
Canada 1.9 1.8 1.7
Mexico 1.2 1.1 1.0
North America 20.2 19.1 17.8
Brazil 3.5 3.8 3.8
Argentina 0.7 0.9 0.8
South America 5.3 5.9 5.9
Britain 2.8 2.6 2.3
Germany 3.4 3.3 3.4
Russia 2.5 2.8 3.0
Turkey 0.8 0.9 0.8
Europe (b) 18.6 18.3 18.6
Middle East & Africa 4.2 3.9 4.0
China 24.0 22.2 19.0
Australia 1.1 1.1 1.1
India 3.2 3.3 3.6
ASEAN (c) 3.1 3.5 3.4
Asia Pacific 39.6 37.8 34.8
Global 87.9 85.0 81.1
______________
(a) Industry sales volume is an internal estimate based on publicly-available data collected from various government, private, and public sources
around the globe and is based, in part, on estimated vehicle registrations.
(b) Europe 20 industry sales volume was 14.6 million, 13.8 million, and 14.1 million in 2014, 2013, and 2012, respectively. Europe 20 consists of
Austria, Belgium, Britain, Czech Republic, Denmark, Finland, France, Germany, Greece, Hungary, Ireland, Italy, Netherlands, Norway, Poland,
Portugal, Romania, Spain, Sweden, and Switzerland.
(c) ASEAN includes Indonesia, Philippines, Thailand, Vietnam, and Malaysia.
5