Fannie Mae 2011 Annual Report Download - page 9
Download and view the complete annual report
Please find page 9 of the 2011 Fannie Mae annual report below. You can navigate through the pages in the report by either clicking on the pages listed below, or by using the keyword search tool below to find specific information within the annual report.-
 1
1 -
 2
2 -
 3
3 -
 4
4 -
 5
5 -
 6
6 -
 7
7 -
 8
8 -
 9
9 -
 10
10 -
 11
11 -
 12
12 -
 13
13 -
 14
14 -
 15
15 -
 16
16 -
 17
17 -
 18
18 -
 19
19 -
 20
20 -
21
-
22
-
23
-
24
-
25
-
26
-
27
-
28
-
29
-
30
-
31
-
32
-
33
-
34
-
35
-
36
-
37
-
38
-
39
-
40
-
41
-
42
-
43
-
44
-
45
-
46
-
47
-
48
-
49
-
50
-
51
-
52
-
53
-
54
-
55
-
56
-
57
-
58
-
59
-
60
-
61
-
62
-
63
-
64
-
65
-
66
-
67
-
68
-
69
-
70
-
71
-
72
-
73
-
74
-
75
-
76
-
77
-
78
-
79
-
80
-
81
-
82
-
83
-
84
-
85
-
86
-
87
-
88
-
89
-
90
-
91
-
92
-
93
-
94
-
95
-
96
-
97
-
98
-
99
-
100
-
101
-
102
-
103
-
104
-
105
-
106
-
107
-
108
-
109
-
110
-
111
-
112
-
113
-
114
-
115
-
116
-
117
-
118
-
119
-
120
-
121
-
122
-
123
-
124
-
125
-
126
-
127
-
128
-
129
-
130
-
131
-
132
-
133
-
134
-
135
-
136
-
137
-
138
-
139
-
140
-
141
-
142
-
143
-
144
-
145
-
146
-
147
-
148
-
149
-
150
-
151
-
152
-
153
-
154
-
155
-
156
-
157
-
158
-
159
-
160
-
161
-
162
-
163
-
164
-
165
-
166
-
167
-
168
-
169
-
170
-
171
-
172
-
173
-
174
-
175
-
176
-
177
-
178
-
179
-
180
-
181
-
182
-
183
-
184
-
185
-
186
-
187
-
188
-
189
-
190
-
191
-
192
-
193
-
194
-
195
-
196
-
197
-
198
-
199
-
200
-
201
-
202
-
203
-
204
-
205
-
206
-
207
-
208
-
209
-
210
-
211
-
212
-
213
-
214
-
215
-
216
-
217
-
218
-
219
-
220
-
221
-
222
-
223
-
224
-
225
-
226
-
227
-
228
-
229
-
230
-
231
-
232
-
233
-
234
-
235
-
236
-
237
-
238
-
239
-
240
-
241
-
242
-
243
-
244
-
245
-
246
-
247
-
248
-
249
-
250
-
251
-
252
-
253
-
254
-
255
-
256
-
257
-
258
-
259
-
260
-
261
-
262
-
263
-
264
-
265
-
266
-
267
-
268
-
269
-
270
-
271
-
272
-
273
-
274
-
275
-
276
-
277
-
278
-
279
-
280
-
281
-
282
-
283
-
284
-
285
-
286
-
287
-
288
-
289
-
290
-
291
-
292
-
293
-
294
-
295
-
296
-
297
-
298
-
299
-
300
-
301
-
302
-
303
-
304
-
305
-
306
-
307
-
308
-
309
-
310
-
311
-
312
-
313
-
314
-
315
-
316
-
317
-
318
-
319
-
320
-
321
-
322
-
323
-
324
-
325
-
326
-
327
-
328
-
329
-
330
-
331
-
332
-
333
-
334
-
335
-
336
-
337
-
338
-
339
-
340
-
341
-
342
-
343
-
344
-
345
-
346
-
347
-
348
-
349
-
350
-
351
-
352
-
353
-
354
-
355
-
356
-
357
-
358
-
359
-
360
-
361
-
362
-
363
-
364
-
365
-
366
-
367
-
368
-
369
-
370
-
371
-
372
-
373
-
374
 |
 |
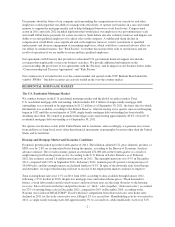
We estimate that total single-family mortgage originations in 2011 decreased from 2010 levels by 20% to $1.4
trillion, with a purchase share of 34% and a refinance share of 66%.
Since the second quarter of 2008, single-family mortgage debt outstanding has been steadily declining due to a
number of factors including declining home sales and prices, rising foreclosures, increased cash sales, and
reduced home equity extraction. We anticipate another approximately 1.1% decline in single-family mortgage
debt outstanding in 2012. Total U.S. residential mortgage debt outstanding fell during the third quarter of 2011
by an annualized rate of 2.1%.
Despite signs of stabilization and improvement, one out of thirteen borrowers was delinquent or in foreclosure
during the fourth quarter of 2011, according to the Mortgage Bankers Association National Delinquency Survey.
The housing market remains under pressure due to the high level of unemployment, which was a primary driver
of the significant number of mortgage delinquencies and defaults in 2011. At the start of the recession in
December 2007, the unemployment rate was 5.0%, based on data from the U.S. Bureau of Labor Statistics. The
unemployment rate peaked at a 26-year high of 10.0% in October 2009, and remained as high as 8.3% in January
2012. We expect the unemployment rate to remain relatively flat in 2012.
The most comprehensive measure of the unemployment rate, which includes those working part-time who would
rather work full-time (part-time workers for economic reasons) and those not looking for work but who want to
work and are available for work (discouraged workers), was 15.1% in January 2012, substantially lower than the
record high of 17.2% in October 2009.
The decline in home prices has left many homeowners with “negative equity” in their homes, which means their
principal mortgage balance exceeds the current market value of their home. This increases the likelihood that
borrowers will walk away from their mortgage obligations and that the loans will become delinquent and proceed
to foreclosure. According to CoreLogic, approximately 11 million, or 22%, of all residential properties with
mortgages were in a negative equity position in the third quarter of 2011. This potential supply also weighs on
the supply/demand balance putting downward pressure on both home prices and rents. See “Risk Factors” for a
description of risks to our business associated with the weak economy and housing market.
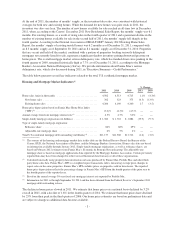
National multifamily market fundamentals, which include factors such as rents and vacancy rates, saw a second
year of steady improvement during 2011, benefiting from increased rental demand coupled with limited new
apartment supply. Vacancy rates continued to decline throughout most of 2011, bringing the sector back to
pre-recession levels.
Based on preliminary third-party data, we estimate that the national multifamily vacancy rate fell to 6.25% in the
fourth quarter of 2011, from 6.50% in the third quarter of 2011 and 7.25% in the fourth quarter of 2010. In
addition, we estimate that average asking rents increased steadily for nearly two years, most recently increasing
by 0.5% in the fourth quarter of 2011 on a national basis. The increase in overall rental demand was also
reflected in an estimated increase of about 50,000 units in the net number of occupied rental units during the
fourth quarter of 2011, according to preliminary data from Reis, Inc. That brings the total estimated net
absorption for the year, (that is, the net change in the number of units occupied over the year), to 170,000 units.
Vacancy rates and rents are important to loan performance because multifamily loans are generally repaid from
the cash flows generated by the underlying property. The year-long strengthening of these fundamentals helped
boost property values and, in turn, spur apartment building sales during 2011 in most metropolitan areas.
While the strength of improving vacancy levels and rental rates will vary by metropolitan area, on a national
basis the multifamily sector should continue to see steady demand in 2012. With job growth slowly improving,
and, more importantly, the lack of new apartment supply becoming available over the next 12 to18 months, we
expect that rental demand will continue to outstrip supply, thereby maintaining stable vacancy levels and healthy
rent growth. As a result, the outlook remains steady for the multifamily sector over the coming year.
-4-