Fannie Mae 2011 Annual Report Download - page 4
Download and view the complete annual report
Please find page 4 of the 2011 Fannie Mae annual report below. You can navigate through the pages in the report by either clicking on the pages listed below, or by using the keyword search tool below to find specific information within the annual report.-
 1
1 -
 2
2 -
 3
3 -
 4
4 -
 5
5 -
 6
6 -
 7
7 -
 8
8 -
 9
9 -
 10
10 -
 11
11 -
 12
12 -
 13
13 -
 14
14 -
 15
15 -
16
-
17
-
18
-
19
-
20
-
21
-
22
-
23
-
24
-
25
-
26
-
27
-
28
-
29
-
30
-
31
-
32
-
33
-
34
-
35
-
36
-
37
-
38
-
39
-
40
-
41
-
42
-
43
-
44
-
45
-
46
-
47
-
48
-
49
-
50
-
51
-
52
-
53
-
54
-
55
-
56
-
57
-
58
-
59
-
60
-
61
-
62
-
63
-
64
-
65
-
66
-
67
-
68
-
69
-
70
-
71
-
72
-
73
-
74
-
75
-
76
-
77
-
78
-
79
-
80
-
81
-
82
-
83
-
84
-
85
-
86
-
87
-
88
-
89
-
90
-
91
-
92
-
93
-
94
-
95
-
96
-
97
-
98
-
99
-
100
-
101
-
102
-
103
-
104
-
105
-
106
-
107
-
108
-
109
-
110
-
111
-
112
-
113
-
114
-
115
-
116
-
117
-
118
-
119
-
120
-
121
-
122
-
123
-
124
-
125
-
126
-
127
-
128
-
129
-
130
-
131
-
132
-
133
-
134
-
135
-
136
-
137
-
138
-
139
-
140
-
141
-
142
-
143
-
144
-
145
-
146
-
147
-
148
-
149
-
150
-
151
-
152
-
153
-
154
-
155
-
156
-
157
-
158
-
159
-
160
-
161
-
162
-
163
-
164
-
165
-
166
-
167
-
168
-
169
-
170
-
171
-
172
-
173
-
174
-
175
-
176
-
177
-
178
-
179
-
180
-
181
-
182
-
183
-
184
-
185
-
186
-
187
-
188
-
189
-
190
-
191
-
192
-
193
-
194
-
195
-
196
-
197
-
198
-
199
-
200
-
201
-
202
-
203
-
204
-
205
-
206
-
207
-
208
-
209
-
210
-
211
-
212
-
213
-
214
-
215
-
216
-
217
-
218
-
219
-
220
-
221
-
222
-
223
-
224
-
225
-
226
-
227
-
228
-
229
-
230
-
231
-
232
-
233
-
234
-
235
-
236
-
237
-
238
-
239
-
240
-
241
-
242
-
243
-
244
-
245
-
246
-
247
-
248
-
249
-
250
-
251
-
252
-
253
-
254
-
255
-
256
-
257
-
258
-
259
-
260
-
261
-
262
-
263
-
264
-
265
-
266
-
267
-
268
-
269
-
270
-
271
-
272
-
273
-
274
-
275
-
276
-
277
-
278
-
279
-
280
-
281
-
282
-
283
-
284
-
285
-
286
-
287
-
288
-
289
-
290
-
291
-
292
-
293
-
294
-
295
-
296
-
297
-
298
-
299
-
300
-
301
-
302
-
303
-
304
-
305
-
306
-
307
-
308
-
309
-
310
-
311
-
312
-
313
-
314
-
315
-
316
-
317
-
318
-
319
-
320
-
321
-
322
-
323
-
324
-
325
-
326
-
327
-
328
-
329
-
330
-
331
-
332
-
333
-
334
-
335
-
336
-
337
-
338
-
339
-
340
-
341
-
342
-
343
-
344
-
345
-
346
-
347
-
348
-
349
-
350
-
351
-
352
-
353
-
354
-
355
-
356
-
357
-
358
-
359
-
360
-
361
-
362
-
363
-
364
-
365
-
366
-
367
-
368
-
369
-
370
-
371
-
372
-
373
-
374
 |
 |

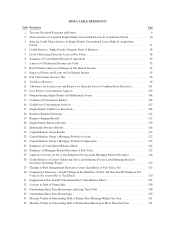
MD&A TABLE REFERENCE
Table Description Page
1 Treasury Dividend Payments and Draws ................................................ 9
2 Characteristics of Acquired Single-Family Conventional Loans by Acquisition Period ............ 10
3 Selected Credit Characteristics of Single-Family Conventional Loans Held, by Acquisition
Period ........................................................................... 11
4 Credit Statistics, Single-Family Guaranty Book of Business ................................. 18
5 Level 3 Recurring Financial Assets at Fair Value ......................................... 86
6 Summary of Consolidated Results of Operations ......................................... 92
7 Analysis of Net Interest Income and Yield .............................................. 93
8 Rate/Volume Analysis of Changes in Net Interest Income .................................. 94
9 Impact of Nonaccrual Loans on Net Interest Income ....................................... 95
10 Fair Value Gains (Losses), Net ....................................................... 96
11 Total Loss Reserves ................................................................ 99
12 Allowance for Loan Losses and Reserve for Guaranty Losses (Combined Loss Reserves) ......... 101
13 Loss Reserve Concentration Analysis .................................................. 103
14 Nonperforming Single-Family and Multifamily Loans ..................................... 104
15 Credit Loss Performance Metrics ...................................................... 106
16 Credit Loss Concentration Analysis .................................................... 107
17 Single-Family Credit Loss Sensitivity .................................................. 108
18 Business Segment Summary ......................................................... 111
19 Business Segment Results ........................................................... 112
20 Single-Family Business Results ....................................................... 113
21 Multifamily Business Results ......................................................... 116
22 Capital Markets Group Results ....................................................... 119
23 Capital Markets Group’s Mortgage Portfolio Activity ..................................... 122
24 Capital Markets Group’s Mortgage Portfolio Composition .................................. 123
25 Summary of Consolidated Balance Sheets ............................................... 124
26 Summary of Mortgage-Related Securities at Fair Value .................................... 125
27 Analysis of Losses on Alt-A and Subprime Private-Label Mortgage-Related Securities ........... 126
28 Credit Statistics of Loans Underlying Alt-A and Subprime Private-Label Mortgage-Related
Securities (Including Wraps) ......................................................... 127
29 Changes in Risk Management Derivative Assets (Liabilities) at Fair Value, Net ................. 129
30 Comparative Measures—GAAP Change in Stockholders’ Deficit and Non-GAAP Change in Fair
Value of Net Assets (Net of Tax Effect) ................................................ 130
31 Supplemental Non-GAAP Consolidated Fair Value Balance Sheets .......................... 132
32 Activity in Debt of Fannie Mae ....................................................... 136
33 Outstanding Short-Term Borrowings and Long-Term Debt ................................. 138
34 Outstanding Short-Term Borrowings ................................................... 139
35 Maturity Profile of Outstanding Debt of Fannie Mae Maturing Within One Year ................ 141
36 Maturity Profile of Outstanding Debt of Fannie Mae Maturing in More Than One Year ........... 141