Fannie Mae 2011 Annual Report Download - page 17
Download and view the complete annual report
Please find page 17 of the 2011 Fannie Mae annual report below. You can navigate through the pages in the report by either clicking on the pages listed below, or by using the keyword search tool below to find specific information within the annual report.-
 1
1 -
2
-
3
-
4
-
5
-
6
-
 7
7 -
 8
8 -
 9
9 -
 10
10 -
 11
11 -
 12
12 -
 13
13 -
 14
14 -
 15
15 -
 16
16 -
 17
17 -
 18
18 -
 19
19 -
 20
20 -
 21
21 -
 22
22 -
 23
23 -
 24
24 -
 25
25 -
 26
26 -
 27
27 -
28
-
29
-
30
-
31
-
32
-
33
-
34
-
35
-
36
-
37
-
38
-
39
-
40
-
41
-
42
-
43
-
44
-
45
-
46
-
47
-
48
-
49
-
50
-
51
-
52
-
53
-
54
-
55
-
56
-
57
-
58
-
59
-
60
-
61
-
62
-
63
-
64
-
65
-
66
-
67
-
68
-
69
-
70
-
71
-
72
-
73
-
74
-
75
-
76
-
77
-
78
-
79
-
80
-
81
-
82
-
83
-
84
-
85
-
86
-
87
-
88
-
89
-
90
-
91
-
92
-
93
-
94
-
95
-
96
-
97
-
98
-
99
-
100
-
101
-
102
-
103
-
104
-
105
-
106
-
107
-
108
-
109
-
110
-
111
-
112
-
113
-
114
-
115
-
116
-
117
-
118
-
119
-
120
-
121
-
122
-
123
-
124
-
125
-
126
-
127
-
128
-
129
-
130
-
131
-
132
-
133
-
134
-
135
-
136
-
137
-
138
-
139
-
140
-
141
-
142
-
143
-
144
-
145
-
146
-
147
-
148
-
149
-
150
-
151
-
152
-
153
-
154
-
155
-
156
-
157
-
158
-
159
-
160
-
161
-
162
-
163
-
164
-
165
-
166
-
167
-
168
-
169
-
170
-
171
-
172
-
173
-
174
-
175
-
176
-
177
-
178
-
179
-
180
-
181
-
182
-
183
-
184
-
185
-
186
-
187
-
188
-
189
-
190
-
191
-
192
-
193
-
194
-
195
-
196
-
197
-
198
-
199
-
200
-
201
-
202
-
203
-
204
-
205
-
206
-
207
-
208
-
209
-
210
-
211
-
212
-
213
-
214
-
215
-
216
-
217
-
218
-
219
-
220
-
221
-
222
-
223
-
224
-
225
-
226
-
227
-
228
-
229
-
230
-
231
-
232
-
233
-
234
-
235
-
236
-
237
-
238
-
239
-
240
-
241
-
242
-
243
-
244
-
245
-
246
-
247
-
248
-
249
-
250
-
251
-
252
-
253
-
254
-
255
-
256
-
257
-
258
-
259
-
260
-
261
-
262
-
263
-
264
-
265
-
266
-
267
-
268
-
269
-
270
-
271
-
272
-
273
-
274
-
275
-
276
-
277
-
278
-
279
-
280
-
281
-
282
-
283
-
284
-
285
-
286
-
287
-
288
-
289
-
290
-
291
-
292
-
293
-
294
-
295
-
296
-
297
-
298
-
299
-
300
-
301
-
302
-
303
-
304
-
305
-
306
-
307
-
308
-
309
-
310
-
311
-
312
-
313
-
314
-
315
-
316
-
317
-
318
-
319
-
320
-
321
-
322
-
323
-
324
-
325
-
326
-
327
-
328
-
329
-
330
-
331
-
332
-
333
-
334
-
335
-
336
-
337
-
338
-
339
-
340
-
341
-
342
-
343
-
344
-
345
-
346
-
347
-
348
-
349
-
350
-
351
-
352
-
353
-
354
-
355
-
356
-
357
-
358
-
359
-
360
-
361
-
362
-
363
-
364
-
365
-
366
-
367
-
368
-
369
-
370
-
371
-
372
-
373
-
374
 |
 |

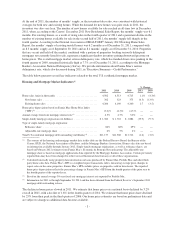
The performance we expect for our single-family loans
As Table 2 shows, we expect loans we have acquired since the beginning of 2009 to be profitable, in contrast to
loans we acquired in 2005 through 2008. Our expectations regarding the ultimate performance of our loans are
based on numerous expectations and assumptions, including those relating to expected changes in regional and
national home prices, borrower behavior, public policy and other macroeconomic factors. If future conditions are
more unfavorable than our expectations, loans we acquired in 2009, 2010 and 2011 could become unprofitable.
For example, we expect that credit losses on these loans would exceed guaranty fee revenue if home prices
declined nationally by approximately 10% from their December 2011 levels over the next five years, based on
our home price index. See “Outlook” for our expectations regarding home price declines.
In our experience, an early predictor of the ultimate performance of a portfolio of loans is the rate at which the
loans become seriously delinquent within a short period of time after acquisition. As Table 2 shows, the
percentage of our 2009 and 2010 acquisitions that were seriously delinquent as of the end of the fourth quarter
following their acquisition year was substantially lower than the average comparable serious delinquency rate for
loans acquired in 2005 through 2008. Table 3 displays the serious delinquency rate for our loans as of
December 31, 2011.
Changes in the Credit Profile of Our Single-Family Acquisitions
Single-family loans we purchased or guaranteed from 2005 through 2008 were acquired during a period when
home prices were rising rapidly, peaked, and then started to decline sharply, and underwriting and eligibility
standards were more relaxed than they are now. These loans were characterized by higher loan-to-value (“LTV”)
ratios and lower FICO credit scores than loans we have acquired since January 1, 2009. In addition, many of
these loans were Alt-A loans or had other higher-risk loan attributes such as interest-only payment features. As a
result of the sharp declines in home prices, 45% of loans we acquired from 2005 through 2008, measured by
unpaid principal balance, had mark-to-market LTV ratios that were greater than 100% as of December 31, 2011,
which means the principal balance of the borrower’s primary mortgage exceeded the current market value of the
borrower’s home. The percentage of borrowers who owed more than their home’s value is higher when second-
lien loans are included. The sharp decline in home prices, the severe economic recession that began in December
2007 and continued through June 2009, and continuing high unemployment and underemployment have
significantly and adversely impacted the performance of loans we acquired from 2005 through 2008. Our 2005
through 2008 acquisitions are becoming a smaller percentage of our single-family guaranty book of business,
having decreased from 39% of our single-family guaranty book of business as of December 31, 2010 to 31% as
of December 31, 2011.
Improvements in the credit risk profile of our acquisitions since the beginning of 2009 over acquisitions in prior
years reflect changes that we made, beginning in 2008, to our pricing and eligibility standards and underwriting.
These changes were intended to more accurately reflect the risk in the housing market and to significantly reduce
our acquisitions of loans with higher-risk attributes. The improvements also reflect changes that mortgage
insurers made to their eligibility standards. We believe the strong early performance of loans in our new single-
family book of business despite the home price declines and high unemployment of the last few years is
attributable to their strong credit risk profile.
The credit risk profile of loans in our new single-family book of business has been further influenced by the
inclusion of a significant percentage of refinanced loans. One effect has been that the original LTV ratios of
loans we acquired in each of 2010 and 2011 increased from the prior year as a result of our acquisition of loans
with higher LTV ratios under our Refi Plus initiative. Refi Plus includes loans refinanced under the Home
Affordable Refinance Program (“HARP”), which was established by the Administration to help borrowers who
may otherwise be unable to refinance the mortgage loan on their primary residence due to a decline in home
values. Original LTV ratios also increased in 2011 as a result of changes by mortgage insurers and the Federal
Housing Administration (“FHA”) that improved the economics of obtaining private mortgage insurance and
drove an increase in our market share of home purchase mortgages with LTV ratios greater than 80%. We
discuss refinancings and their impact on credit risk characteristics, as well as other changes in the credit risk
-12-