Fannie Mae 2011 Annual Report Download - page 18
Download and view the complete annual report
Please find page 18 of the 2011 Fannie Mae annual report below. You can navigate through the pages in the report by either clicking on the pages listed below, or by using the keyword search tool below to find specific information within the annual report.-
 1
1 -
2
-
3
-
4
-
5
-
6
-
7
-
 8
8 -
 9
9 -
 10
10 -
 11
11 -
 12
12 -
 13
13 -
 14
14 -
 15
15 -
 16
16 -
 17
17 -
 18
18 -
 19
19 -
 20
20 -
 21
21 -
 22
22 -
 23
23 -
 24
24 -
 25
25 -
 26
26 -
 27
27 -
 28
28 -
29
-
30
-
31
-
32
-
33
-
34
-
35
-
36
-
37
-
38
-
39
-
40
-
41
-
42
-
43
-
44
-
45
-
46
-
47
-
48
-
49
-
50
-
51
-
52
-
53
-
54
-
55
-
56
-
57
-
58
-
59
-
60
-
61
-
62
-
63
-
64
-
65
-
66
-
67
-
68
-
69
-
70
-
71
-
72
-
73
-
74
-
75
-
76
-
77
-
78
-
79
-
80
-
81
-
82
-
83
-
84
-
85
-
86
-
87
-
88
-
89
-
90
-
91
-
92
-
93
-
94
-
95
-
96
-
97
-
98
-
99
-
100
-
101
-
102
-
103
-
104
-
105
-
106
-
107
-
108
-
109
-
110
-
111
-
112
-
113
-
114
-
115
-
116
-
117
-
118
-
119
-
120
-
121
-
122
-
123
-
124
-
125
-
126
-
127
-
128
-
129
-
130
-
131
-
132
-
133
-
134
-
135
-
136
-
137
-
138
-
139
-
140
-
141
-
142
-
143
-
144
-
145
-
146
-
147
-
148
-
149
-
150
-
151
-
152
-
153
-
154
-
155
-
156
-
157
-
158
-
159
-
160
-
161
-
162
-
163
-
164
-
165
-
166
-
167
-
168
-
169
-
170
-
171
-
172
-
173
-
174
-
175
-
176
-
177
-
178
-
179
-
180
-
181
-
182
-
183
-
184
-
185
-
186
-
187
-
188
-
189
-
190
-
191
-
192
-
193
-
194
-
195
-
196
-
197
-
198
-
199
-
200
-
201
-
202
-
203
-
204
-
205
-
206
-
207
-
208
-
209
-
210
-
211
-
212
-
213
-
214
-
215
-
216
-
217
-
218
-
219
-
220
-
221
-
222
-
223
-
224
-
225
-
226
-
227
-
228
-
229
-
230
-
231
-
232
-
233
-
234
-
235
-
236
-
237
-
238
-
239
-
240
-
241
-
242
-
243
-
244
-
245
-
246
-
247
-
248
-
249
-
250
-
251
-
252
-
253
-
254
-
255
-
256
-
257
-
258
-
259
-
260
-
261
-
262
-
263
-
264
-
265
-
266
-
267
-
268
-
269
-
270
-
271
-
272
-
273
-
274
-
275
-
276
-
277
-
278
-
279
-
280
-
281
-
282
-
283
-
284
-
285
-
286
-
287
-
288
-
289
-
290
-
291
-
292
-
293
-
294
-
295
-
296
-
297
-
298
-
299
-
300
-
301
-
302
-
303
-
304
-
305
-
306
-
307
-
308
-
309
-
310
-
311
-
312
-
313
-
314
-
315
-
316
-
317
-
318
-
319
-
320
-
321
-
322
-
323
-
324
-
325
-
326
-
327
-
328
-
329
-
330
-
331
-
332
-
333
-
334
-
335
-
336
-
337
-
338
-
339
-
340
-
341
-
342
-
343
-
344
-
345
-
346
-
347
-
348
-
349
-
350
-
351
-
352
-
353
-
354
-
355
-
356
-
357
-
358
-
359
-
360
-
361
-
362
-
363
-
364
-
365
-
366
-
367
-
368
-
369
-
370
-
371
-
372
-
373
-
374
 |
 |
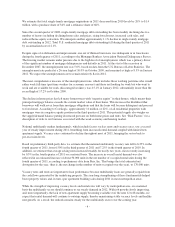
characteristics of our loan acquisitions, in more detail in “MD&A—Risk Management—Credit Risk
Management—Single-Family Mortgage Credit Risk Management.”
Whether the loans we acquire in the future will exhibit an overall credit profile similar to our more recent
acquisitions will depend on a number of factors, including our future pricing and eligibility standards and those
of mortgage insurers and FHA, the percentage of loan originations representing refinancings, our future
objectives, government policy, market and competitive conditions, and the volume and characteristics of loans
we acquire under the recently announced changes to the terms of HARP.
Expected Losses on Our Legacy Book of Business
The single-family credit losses we realized in 2009 through 2011, combined with the amounts we have reserved
for single-family credit losses as of December 31, 2011, as described below, total approximately $140 billion. A
substantial majority of these losses are attributable to single-family loans we purchased or guaranteed from 2005
through 2008.
While loans we acquired in 2005 through 2008 will give rise to additional credit losses that we will realize when
the loans are charged off (upon foreclosure or our acceptance of a short sale or deed-in-lieu of foreclosure), we
estimate that we have reserved for the substantial majority of the remaining losses on these loans. Even though
we believe a substantial majority of the credit losses we have yet to realize on these loans has already been
reflected in our results of operations as credit-related expenses, our credit-related expenses have remained high as
weakness in the housing and mortgage markets continues. We expect that our credit-related expenses will
continue to be high in 2012 but that, overall, our credit-related expenses will be lower in 2012 than in 2011. The
amount of credit-related expenses we incur each period will be affected by changes in expected and actual home
prices, modifications and foreclosure activity during the period.
We expect our loss reserves will remain significantly elevated relative to historical levels for an extended period
because (1) we expect future defaults on loans in our legacy book of business and the resulting charge-offs will
occur over a period of years and (2) a significant portion of our reserves represents concessions granted to
borrowers upon modification of their loans and will remain in our reserves until the loans are fully repaid or
default. In addition, given the large existing and anticipated supply of single-family homes in the market, we
anticipate that it will take years before our REO inventory is reduced to pre-2008 levels.
We show how we calculate our realized credit losses in “Table 15: Credit Loss Performance Metrics.” Our
reserves for credit losses described in this discussion consist of (1) our allowance for loan losses, (2) our
allowance for accrued interest receivable, (3) our allowance for preforeclosure property taxes and insurance
receivables, and (4) our reserve for guaranty losses (collectively, our “total loss reserves”), plus the portion of
fair value losses on loans purchased out of unconsolidated MBS trusts reflected in our consolidated balance
sheets that we estimate represents accelerated credit losses we expect to realize. For more information on our
reserves for credit losses, see “Table 11: Total Loss Reserves.”
The fair value losses that we consider part of our reserves are not included in our “total loss reserves.” We
recorded the majority of these fair value losses prior to our adoption in 2010 of accounting guidance on the
transfers of financial assets and the consolidation of variable interest entities. Before we adopted this guidance,
upon our acquisition of credit-impaired loans out of unconsolidated MBS trusts, we recorded fair value loss
charge-offs against our reserve for guaranty losses. The amount of these charge-offs was the amount by which
the acquisition cost of these loans exceeded their estimated fair value. We expect to realize a portion of these fair
value losses as credit losses in the future (for loans that eventually involve foreclosures, short sales or
deeds-in-lieu of foreclosure), yet these fair value losses have already reduced the mortgage loan balances
reflected in our consolidated balance sheets and have effectively been recognized in our consolidated statements
of operations and comprehensive loss through our provision for guaranty losses. We consider these fair value
losses as an “effective reserve,” apart from our total loss reserves, to the extent that we expect to realize these
amounts as credit losses on the acquired loans in the future.
-13-