Fannie Mae 2011 Annual Report Download - page 13
Download and view the complete annual report
Please find page 13 of the 2011 Fannie Mae annual report below. You can navigate through the pages in the report by either clicking on the pages listed below, or by using the keyword search tool below to find specific information within the annual report.-
 1
1 -
2
-
 3
3 -
 4
4 -
 5
5 -
 6
6 -
 7
7 -
 8
8 -
 9
9 -
 10
10 -
 11
11 -
 12
12 -
 13
13 -
 14
14 -
 15
15 -
 16
16 -
 17
17 -
 18
18 -
 19
19 -
 20
20 -
 21
21 -
 22
22 -
 23
23 -
24
-
25
-
26
-
27
-
28
-
29
-
30
-
31
-
32
-
33
-
34
-
35
-
36
-
37
-
38
-
39
-
40
-
41
-
42
-
43
-
44
-
45
-
46
-
47
-
48
-
49
-
50
-
51
-
52
-
53
-
54
-
55
-
56
-
57
-
58
-
59
-
60
-
61
-
62
-
63
-
64
-
65
-
66
-
67
-
68
-
69
-
70
-
71
-
72
-
73
-
74
-
75
-
76
-
77
-
78
-
79
-
80
-
81
-
82
-
83
-
84
-
85
-
86
-
87
-
88
-
89
-
90
-
91
-
92
-
93
-
94
-
95
-
96
-
97
-
98
-
99
-
100
-
101
-
102
-
103
-
104
-
105
-
106
-
107
-
108
-
109
-
110
-
111
-
112
-
113
-
114
-
115
-
116
-
117
-
118
-
119
-
120
-
121
-
122
-
123
-
124
-
125
-
126
-
127
-
128
-
129
-
130
-
131
-
132
-
133
-
134
-
135
-
136
-
137
-
138
-
139
-
140
-
141
-
142
-
143
-
144
-
145
-
146
-
147
-
148
-
149
-
150
-
151
-
152
-
153
-
154
-
155
-
156
-
157
-
158
-
159
-
160
-
161
-
162
-
163
-
164
-
165
-
166
-
167
-
168
-
169
-
170
-
171
-
172
-
173
-
174
-
175
-
176
-
177
-
178
-
179
-
180
-
181
-
182
-
183
-
184
-
185
-
186
-
187
-
188
-
189
-
190
-
191
-
192
-
193
-
194
-
195
-
196
-
197
-
198
-
199
-
200
-
201
-
202
-
203
-
204
-
205
-
206
-
207
-
208
-
209
-
210
-
211
-
212
-
213
-
214
-
215
-
216
-
217
-
218
-
219
-
220
-
221
-
222
-
223
-
224
-
225
-
226
-
227
-
228
-
229
-
230
-
231
-
232
-
233
-
234
-
235
-
236
-
237
-
238
-
239
-
240
-
241
-
242
-
243
-
244
-
245
-
246
-
247
-
248
-
249
-
250
-
251
-
252
-
253
-
254
-
255
-
256
-
257
-
258
-
259
-
260
-
261
-
262
-
263
-
264
-
265
-
266
-
267
-
268
-
269
-
270
-
271
-
272
-
273
-
274
-
275
-
276
-
277
-
278
-
279
-
280
-
281
-
282
-
283
-
284
-
285
-
286
-
287
-
288
-
289
-
290
-
291
-
292
-
293
-
294
-
295
-
296
-
297
-
298
-
299
-
300
-
301
-
302
-
303
-
304
-
305
-
306
-
307
-
308
-
309
-
310
-
311
-
312
-
313
-
314
-
315
-
316
-
317
-
318
-
319
-
320
-
321
-
322
-
323
-
324
-
325
-
326
-
327
-
328
-
329
-
330
-
331
-
332
-
333
-
334
-
335
-
336
-
337
-
338
-
339
-
340
-
341
-
342
-
343
-
344
-
345
-
346
-
347
-
348
-
349
-
350
-
351
-
352
-
353
-
354
-
355
-
356
-
357
-
358
-
359
-
360
-
361
-
362
-
363
-
364
-
365
-
366
-
367
-
368
-
369
-
370
-
371
-
372
-
373
-
374
 |
 |
We remained a constant source of liquidity in the multifamily market. We owned or guaranteed approximately
21% of the outstanding debt on multifamily properties as of September 30, 2011 (the latest date for which
information was available).
Summary of Our Financial Performance for 2011
Our financial results for 2011 reflect the continued weakness in the housing and mortgage markets, which remain
under pressure from high levels of unemployment and underemployment, and the prolonged decline in home
prices since their peak in the third quarter of 2006. Our credit-related expenses continue to be a key driver of our
net losses for each period presented. The substantial majority of our credit-related expenses are from single-
family loans we acquired prior to 2009, which decreased as a percentage of our single-family guaranty book of
business to 47% as of December 31, 2011 from 60% as of December 31, 2010. Our credit-related expenses vary
from period to period primarily based on changes in home prices, borrower payment behavior, the types and
volumes of loss mitigation activities completed, and actual and estimated recoveries from our lender and
mortgage insurer counterparties.
In addition, the decline in interest rates during 2011 resulted in significant fair value losses on our
derivatives. These fair value losses on our derivatives were offset by fair value gains during 2011 related to our
mortgage investments; however, only a portion of these investments is recorded at fair value in our financial
statements. Derivative instruments are an integral part of how we manage interest rate risk and an inherent part of
the cost of funding and hedging our mortgage investments. We expect high levels of period-to-period volatility in
our results because our derivatives are recorded at fair value in our financial statements while some of the
instruments they hedge are not recorded at fair value in our financial statements.
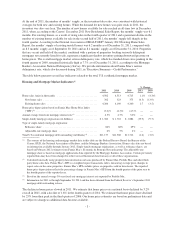
Total Comprehensive Loss
We recognized a total comprehensive loss of $16.4 billion for 2011, consisting of a net loss of $16.9 billion and
other comprehensive income of $447 million. In comparison, our total comprehensive loss for 2010 was $10.6
billion, consisting of a net loss of $14.0 billion and other comprehensive income of $3.4 billion.
The increase in our net loss in 2011, as compared with 2010, was primarily due to an increase in net fair value
losses and credit-related expenses, which were partially offset by an increase in net interest income. The primary
drivers of these changes were:
• a $6.1 billion increase in net fair value losses primarily driven by losses on our risk management derivatives
in 2011 due to a significant decline in swap rates during the period;
• a $2.9 billion increase in net interest income driven by lower interest expense on debt, which was partially
offset by lower interest income on loans and securities;
• an $884 million increase in credit-related expenses primarily driven by a decline in actual and projected
home prices.
The $3.0 billion decline in our other comprehensive income was primarily driven by lower gains on the fair value of
our available-for-sale securities due to widening credit spreads in 2011 compared with narrowing spreads in 2010.
See “Consolidated Results of Operations” for more information on our results.
Net Worth
Our net worth deficit of $4.6 billion as of December 31, 2011 reflects the recognition of our total comprehensive
loss of $1.9 billion and our payment to Treasury of $2.6 billion in senior preferred stock dividends during the
fourth quarter of 2011. The Acting Director of FHFA will submit a request to Treasury on our behalf for $4.6
billion to eliminate our net worth deficit.
In the fourth quarter of 2011, we received $7.8 billion in funds from Treasury to eliminate our net worth deficit
as of September 30, 2011. Upon receipt of the additional funds requested to eliminate our net worth deficit as of
-8-