Entergy 2013 Annual Report Download - page 37
Download and view the complete annual report
Please find page 37 of the 2013 Entergy annual report below. You can navigate through the pages in the report by either clicking on the pages listed below, or by using the keyword search tool below to find specific information within the annual report.-
 1
1 -
2
-
3
-
4
-
5
-
6
-
7
-
8
-
9
-
10
-
11
-
12
-
13
-
14
-
15
-
16
-
17
-
18
-
19
-
20
-
21
-
22
-
23
-
24
-
25
-
26
-
 27
27 -
 28
28 -
 29
29 -
 30
30 -
 31
31 -
 32
32 -
 33
33 -
 34
34 -
 35
35 -
 36
36 -
 37
37 -
 38
38 -
 39
39 -
 40
40 -
 41
41 -
 42
42 -
 43
43 -
 44
44 -
 45
45 -
 46
46 -
 47
47 -
48
-
49
-
50
-
51
-
52
-
53
-
54
-
55
-
56
-
57
-
58
-
59
-
60
-
61
 |
 |
Entergy Corporation 2013 INTEGRATED REPORT 36
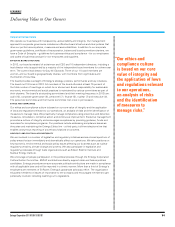
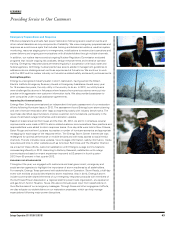
ECONOMIC
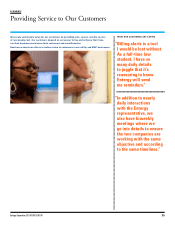
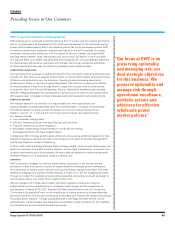
Providing Service to Our Customers
Attracts Economic Development…
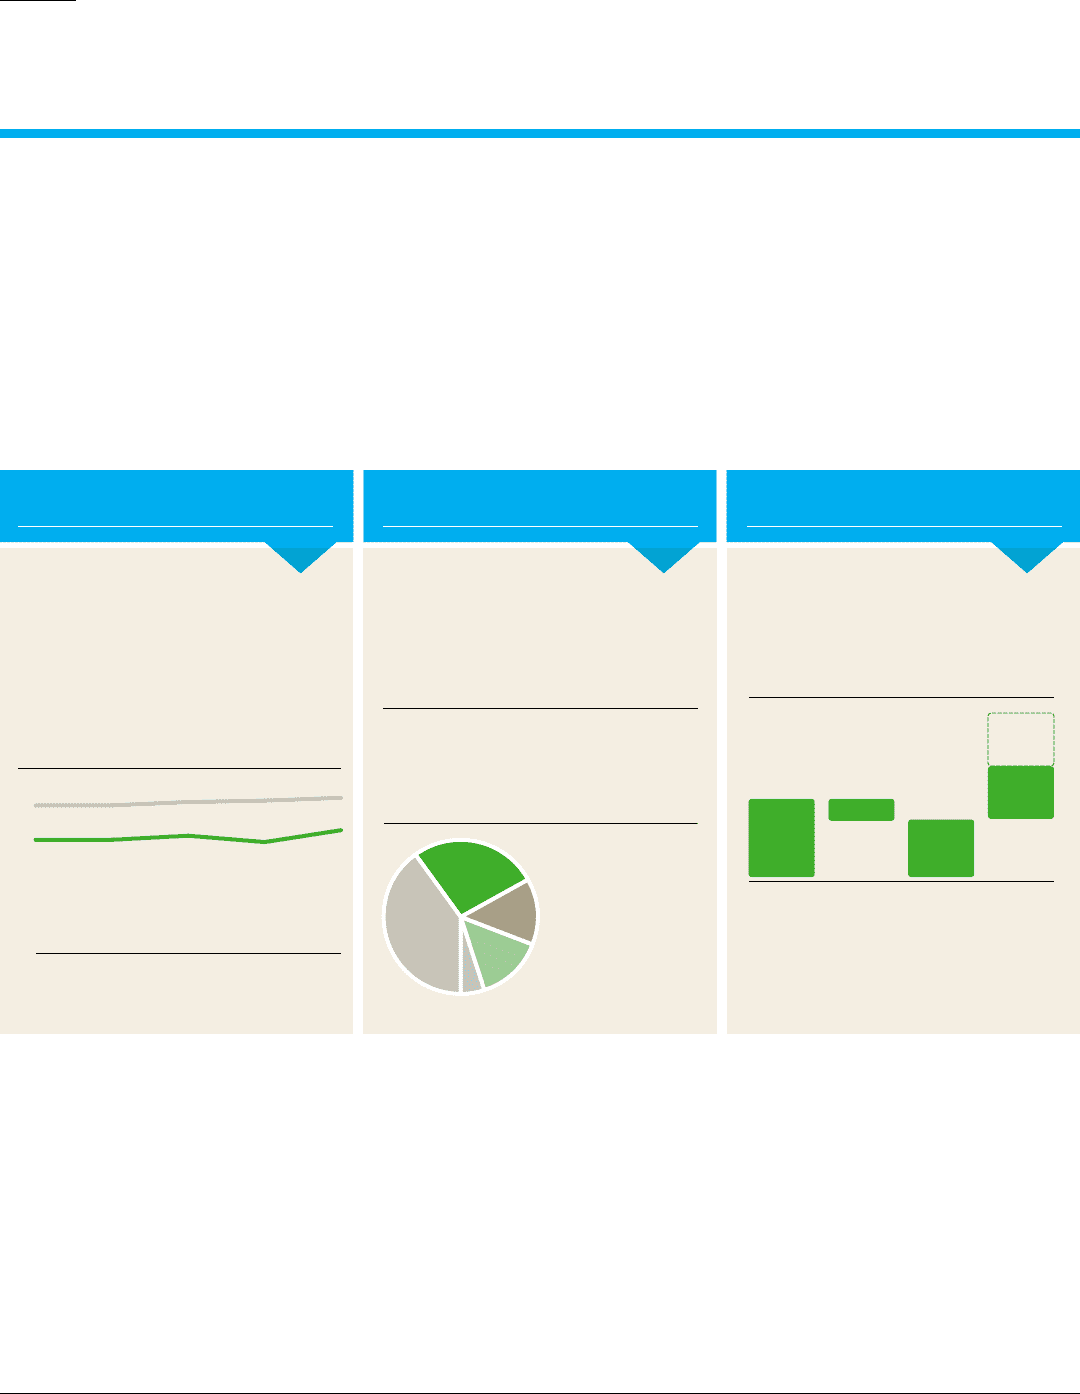
As of Dec. 31, 2013, there were approximately
85 projects totaling 2,400 megawatts and $65
billion investment in Entergy’s potential pipeline.
■ Chemicals 40%
■ Transportation &
Warehousing 27%
■ Other 14%
■ Steel, Metals 14%
■ Wood, Pulp & Paper 5%
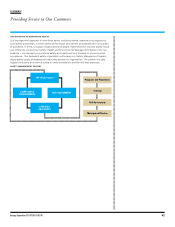
Pipeline of Potential Projects
% of Load in MW
Utility: Powering a Renaissance
Our utility business includes six retail electric utility subsidiaries that generate, transmit, distribute and sell electric power to retail and
wholesale customers in Arkansas, Louisiana, Mississippi and Texas. Two of our subsidiaries also provide natural gas utility services to
customers in and around New Orleans and Baton Rouge, La. Growing our utilities is a key area of focus as we enter 2014, driven primarily
by the industrial renaissance that is unique to the Gulf South region. We currently expect operational net income from our utility business
to grow at a 5 to 7 percent compound annual average growth rate from 2013 through 2016 (off previously estimated 2013 net income),
meaning $950 million to $1 billion by 2016.
A “WINDOW OF OPPORTUNITY” FOR ECONOMIC DEVELOPMENT
The significant regional disparity of global energy prices clearly favors the United States against other countries, particularly in the regions we
serve. Reasonable rates from Entergy utilities also help our communities attract the type of economic development that creates jobs, increases
the tax base and generates increased demand for electricity. We also have business-minded state and local governments, communities that are
receptive to industrial development and the infrastructure in place to support the type of energy-intensive industries looking to locate in the U.S.
These factors combined create a great environment for new market opportunities through economic development in the coming years.
INVESTING TO SERVE CUSTOMERS
Even as our sales grow, we can continue to provide electricity from a fleet that has average emission rates well below the national average
in both conventional pollutants and greenhouse gases. We also now have better access to a broader pool of resources to serve existing and
new customers through MISO. Depending on the magnitude and timing of how the economic development opportunity unfolds, it may lead to
additional transmission and generation investment in the future. We could also see future incremental generation and transmission investment
opportunities to benefit customers to replace aging infrastructure, meet normal sales growth and comply with evolving reliability and other
standards as well as incremental transmission investment for economically driven projects and inter-regional planning if approved by MISO.
ECONOMIC DEVELOPMENT PROGRESS REPORT
As of 12/31/13; Load in MW
Status Load Potential
Potential Pipeline (~85 Projects) 2,400
Contracts Signed 1,040
Under Construction 450
Maintaining Reasonable Rates…
Our utilities are focused on generating
safe, secure, reliable power at reasonable rates.
Our residential, commercial and industrial rates
remain among the lowest in the nation. Our
residential rates are in the lowest quartile in the
majority of our retail jurisdictions and our low
industrial rates are contributing to industrial
growth in our region.
and Drives Sales Growth.
We project compound annual average sales
growth of 2 to 2.25 percent from 2013 to 2016,
which is 1 percent higher than our average
normalized growth levels.
■ Entergy Utilities
■ U.S.
AVERAGE RESIDENTIAL ELECTRIC RATES
Cents per kWh
0
2
4
6
8
10
12
14
20132012201120102009
1.25 – 1.75
0.25 – 0.50
1 – 1.25
2 – 2.25
Up to
3 – 3.25
WEATHER-ADJUSTED SALES GROWTH
3-Year CAGR (2013– 2016E); %
Base Sales
Growth
Before
Energy
Efficiency
Base Growth
with Impact
of Energy
Efficiency
Energy
Efficiency
Range of
Potential
Industrial
Expansion