Entergy 2013 Annual Report Download - page 29
Download and view the complete annual report
Please find page 29 of the 2013 Entergy annual report below. You can navigate through the pages in the report by either clicking on the pages listed below, or by using the keyword search tool below to find specific information within the annual report.-
 1
1 -
2
-
3
-
4
-
5
-
6
-
7
-
8
-
9
-
10
-
11
-
12
-
13
-
14
-
15
-
16
-
17
-
18
-
 19
19 -
 20
20 -
 21
21 -
 22
22 -
 23
23 -
 24
24 -
 25
25 -
 26
26 -
 27
27 -
 28
28 -
 29
29 -
 30
30 -
 31
31 -
 32
32 -
 33
33 -
 34
34 -
 35
35 -
 36
36 -
 37
37 -
 38
38 -
 39
39 -
40
-
41
-
42
-
43
-
44
-
45
-
46
-
47
-
48
-
49
-
50
-
51
-
52
-
53
-
54
-
55
-
56
-
57
-
58
-
59
-
60
-
61
 |
 |
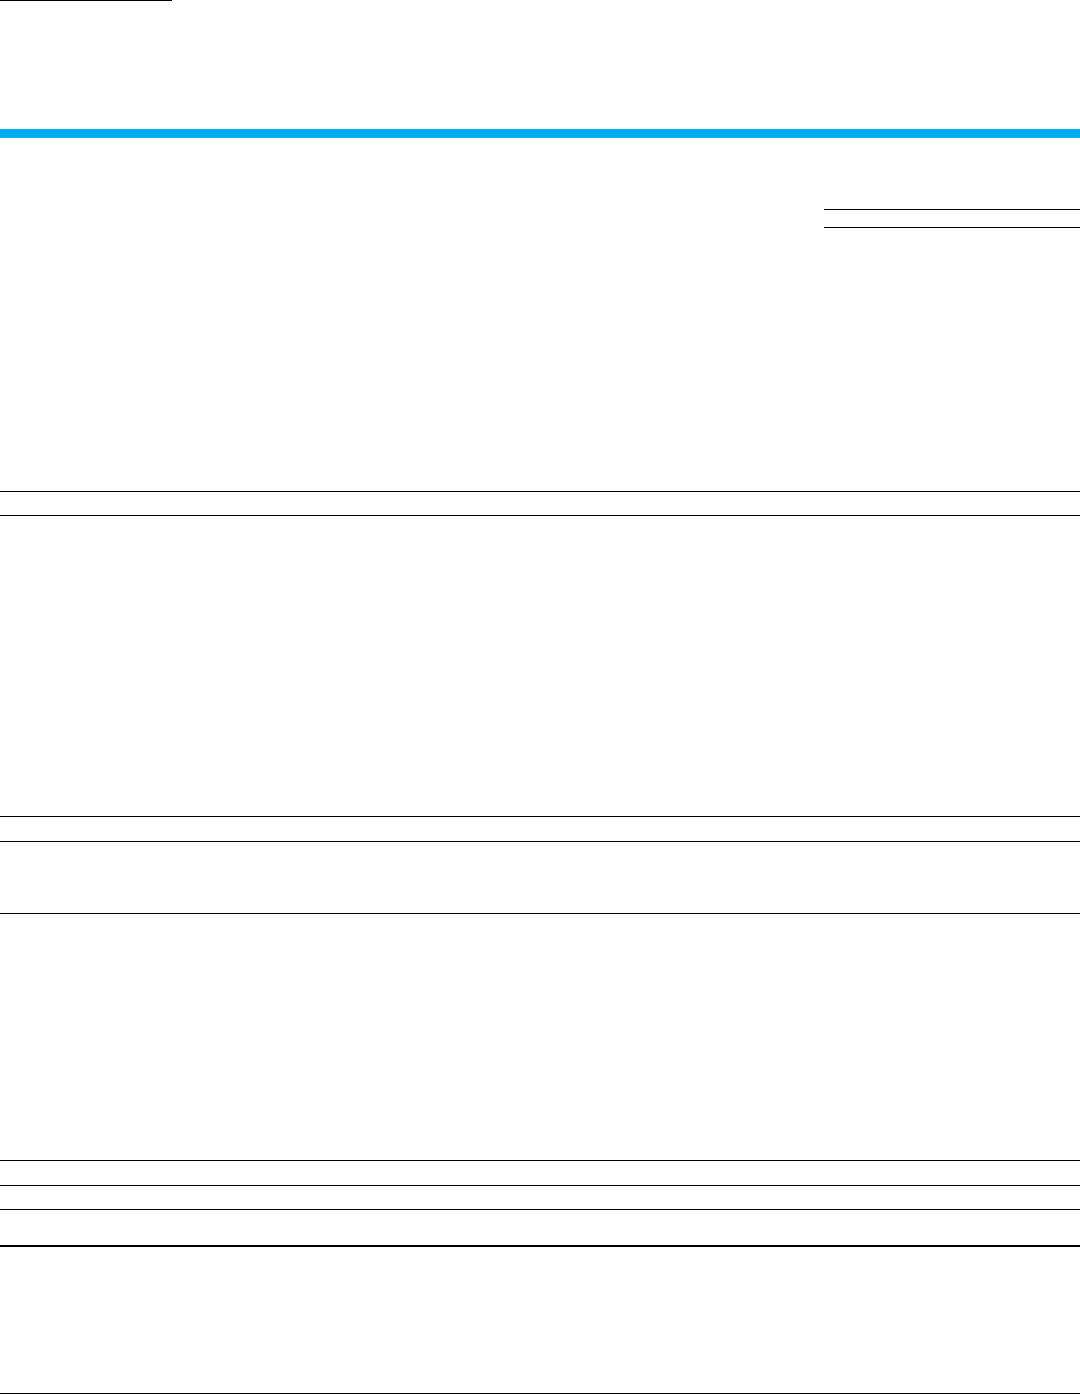
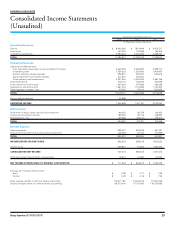
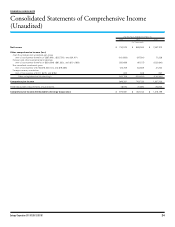
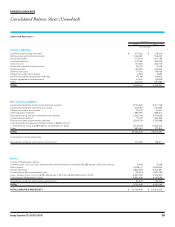
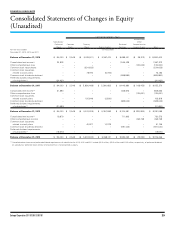
Entergy Corporation 2013 INTEGRATED REPORT 28
LIABILITIES AND EQUITY
December 31,
2013 2012
(In Thousands)
Current Liabilities
Currently maturing long-term debt $ 457,095 $ 718,516
Notes payable and commercial paper 1,046,887 796,002
Accounts payable 1,173,313 1,217,180
Customer deposits 370,997 359,078
Taxes accrued 191,093 333,719
Accumulated deferred income taxes 28,307 13,109
Interest accrued 180,997 184,664
Deferred fuel costs 57,631 96,439
Obligations under capital leases 2,323 3,880
Pension and other postretirement liabilities 67,419 95,900
System agreement cost equalization 61,040 25,848
Other 423,470 261,986
TOTAL 4,060,572 4,106,321
Non-Current Liabilities
Accumulated deferred income taxes and taxes accrued 8,724,635 8,311,756
Accumulated deferred investment tax credits 263,765 273,696
Obligations under capital leases 32,218 34,541
Other regulatory liabilities 1,295,955 898,614
Decommissioning and asset retirement cost liabilities 3,933,416 3,513,634
Accumulated provisions 115,139 362,226
Pension and other postretirement liabilities 2,320,704 3,725,886
Long-term debt (includes securitization bonds of $883,013 as of
December 31, 2013 and $973,480 as of December 31, 2012) 12,139,149 11,920,318
Other 583,667 577,910
TOTAL 29,408,648 29,618,581
Commitments and Contingencies
Subsidiaries’ preferred stock without sinking fund 210,760 186,511
Equity
Common Shareholders’ Equity:
Common stock, $.01 par value, authorized 500,000,000 shares; issued 254,752,788 shares in 2013 and in 2012 2,548 2,548
Paid-in capital 5,368,131 5,357,852
Retained earnings 9,825,053 9,704,591
Accumulated other comprehensive loss (29,324) (293,083)
Less – treasury stock, at cost (76,381,936 shares in 2013 and 76,945,239 shares in 2012) 5,533,942 5,574,819
Total common shareholders’ equity 9,632,466 9,197,089
Subsidiaries’ preferred stock without sinking fund 94,000 94,000
TOTAL 9,726,466 9,291,089
TOTAL LIABILITIES AND EQUITY $ 43,406,446 $ 43,202,502
FINANCIAL HIGHLIGHTS
Consolidated Balance Sheets (Unaudited)