Entergy 2013 Annual Report Download - page 25
Download and view the complete annual report
Please find page 25 of the 2013 Entergy annual report below. You can navigate through the pages in the report by either clicking on the pages listed below, or by using the keyword search tool below to find specific information within the annual report.-
 1
1 -
2
-
3
-
4
-
5
-
6
-
7
-
8
-
9
-
10
-
11
-
12
-
13
-
14
-
 15
15 -
 16
16 -
 17
17 -
 18
18 -
 19
19 -
 20
20 -
 21
21 -
 22
22 -
 23
23 -
 24
24 -
 25
25 -
 26
26 -
 27
27 -
 28
28 -
 29
29 -
 30
30 -
 31
31 -
 32
32 -
 33
33 -
 34
34 -
 35
35 -
36
-
37
-
38
-
39
-
40
-
41
-
42
-
43
-
44
-
45
-
46
-
47
-
48
-
49
-
50
-
51
-
52
-
53
-
54
-
55
-
56
-
57
-
58
-
59
-
60
-
61
 |
 |

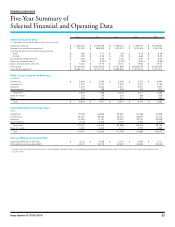
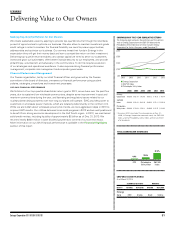
Entergy Corporation 2013 INTEGRATED REPORT 24
For the Years Ended December 31,
2013 2012 2011
(In Thousands)
Net Income $ 730,572 $ 868,363 $ 1,367,372
Other comprehensive income (loss)
Cash flow hedges net unrealized gain (loss)
(net of tax expense (benefit) of ($87,940), ($55,750), and $34,411) (161,682) (97,591) 71,239
Pension and other postretirement liabilities
(net of tax expense (benefit) of $220,899, ($61,223), and ($131,198)) 302,489 (91,157) (223,090)
Net unrealized investment gains
(net of tax expense of $118,878, $61,104, and $19,368) 122,709 63,609 21,254
Foreign currency translation
(net of tax expense of $131, $275, and $192) 243 508 357
Other comprehensive income (loss) 263,759 (124,631) (130,240)
Comprehensive Income 994,331 743,732 1,237,132
Preferred dividend requirements of subsidiaries 18,670 21,690 20,933
Comprehensive Income Attributable to Entergy Corporation $ 975,661 $ 722,042 $ 1,216,199
FINANCIAL HIGHLIGHTS
Consolidated Statements of Comprehensive Income
(Unaudited)