Entergy 2013 Annual Report Download - page 20
Download and view the complete annual report
Please find page 20 of the 2013 Entergy annual report below. You can navigate through the pages in the report by either clicking on the pages listed below, or by using the keyword search tool below to find specific information within the annual report.-
 1
1 -
2
-
3
-
4
-
5
-
6
-
7
-
8
-
9
-
 10
10 -
 11
11 -
 12
12 -
 13
13 -
 14
14 -
 15
15 -
 16
16 -
 17
17 -
 18
18 -
 19
19 -
 20
20 -
 21
21 -
 22
22 -
 23
23 -
 24
24 -
 25
25 -
 26
26 -
 27
27 -
 28
28 -
 29
29 -
 30
30 -
31
-
32
-
33
-
34
-
35
-
36
-
37
-
38
-
39
-
40
-
41
-
42
-
43
-
44
-
45
-
46
-
47
-
48
-
49
-
50
-
51
-
52
-
53
-
54
-
55
-
56
-
57
-
58
-
59
-
60
-
61
 |
 |

Entergy Corporation 2013 INTEGRATED REPORT 19
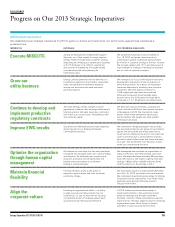
AT A GLANCE
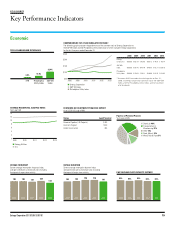
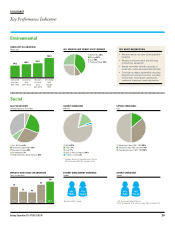
Key Performance Indicators
Economic
ETR Philadelphia
Utility Index
S&P 500
Index
4.4% 11.0%
32.4%
TOTAL SHAREHOLDER RETURN 2013
93% 90% 93% 89% 89%
EWC NUCLEAR FLEET CAPACITY FACTORS
2009 2010 2011 2012 2013
ECONOMIC DEVELOPMENT PROGRESS REPORT
As of 12/31/13; Load in MW
Status Load Potential
Potential Pipeline (~85 Projects) 2,400
Contracts Signed 1,040
Under Construction 450
2009 2010 2011 2012 2013
1.66 1.66 1.61 1.68 1.52
OUTAGE FREQUENCY
System average interruption frequency index;
average number per customer per year, excluding
the impact of major storm activity
182 185 196 196 181
OUTAGE DURATION
System average interruption duration index;
average minutes per customer per year, excluding
the impact of major storm activity
2009 2010 2011 2012 2013
$50
$100
$150
$200
$250
■ Entergy Corporation
■ S&P 500 Index
■ Philadelphia Utility Index
201320122011201020092008
COMPARISON OF FIVE-YEAR CUMULATIVE RETURN(a)
The following graph compares the performance of the common stock of Entergy Corporation to
the S&P 500 Index and the Philadelphia Utility Index (each of which includes Entergy Corporation)
for the last five years ended December 31.
2008 2009 2010 2011 2012 2013
Entergy
Corporation $ 100.00 $ 102.43 $ 92.46 $ 100.12 $ 91.75 $ 95.74
S&P 500
Index $ 100.00 $ 126.45 $ 145.49 $ 148.55 $ 172.31 $ 228.10
Philadelphia
Utility Index $ 100.00 $ 110.04 $ 116.31 $ 138.69 $ 137.91 $ 153.05
(a) Assumes $100 invested at the closing price on Dec. 31,
2008, in Entergy Corporation common stock, the S&P 500
Index, and the Philadelphia Utility Index, and reinvestment
of all dividends.
■ Entergy Utilities
■ U.S.
AVERAGE RESIDENTIAL ELECTRIC RATES
Cents per kWh
0
2
4
6
8
10
12
14
20132012201120102009
■ Chemicals 40%
■ Transportation &
Warehousing 27%
■ Other 14%
■ Steel, Metals 14%
■ Wood, Pulp & Paper 5%
Pipeline of Potential Projects
% of Load in MW