Entergy 2013 Annual Report Download - page 30
Download and view the complete annual report
Please find page 30 of the 2013 Entergy annual report below. You can navigate through the pages in the report by either clicking on the pages listed below, or by using the keyword search tool below to find specific information within the annual report.-
 1
1 -
2
-
3
-
4
-
5
-
6
-
7
-
8
-
9
-
10
-
11
-
12
-
13
-
14
-
15
-
16
-
17
-
18
-
19
-
 20
20 -
 21
21 -
 22
22 -
 23
23 -
 24
24 -
 25
25 -
 26
26 -
 27
27 -
 28
28 -
 29
29 -
 30
30 -
 31
31 -
 32
32 -
 33
33 -
 34
34 -
 35
35 -
 36
36 -
 37
37 -
 38
38 -
 39
39 -
 40
40 -
41
-
42
-
43
-
44
-
45
-
46
-
47
-
48
-
49
-
50
-
51
-
52
-
53
-
54
-
55
-
56
-
57
-
58
-
59
-
60
-
61
 |
 |

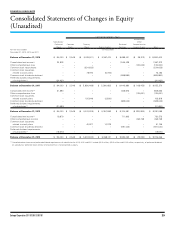
Entergy Corporation 2013 INTEGRATED REPORT 29
Common Shareholders’ Equity
Accumulated
Subsidiaries’ Other
Preferred Common Treasury Retained Comprehensive
Stock Stock Stock Paid-in Capital Earnings Income (Loss) Total
For the Years Ended (In Thousands)
December 31, 2013, 2012 and 2011
Balance at December 31, 2010 $ 94,000 $ 2,548 ($ 5,524,811) $ 5,367,474 $ 8,689,401 ($ 38,212) $ 8,590,400
Consolidated net income(a) 20,933 – – – 1,346,439 – 1,367,372
Other comprehensive loss – – – – – (130,240) (130,240)
Common stock repurchases – – (234,632) – – – (234,632)
Common stock issuances
related to stock plans – – 78,975 (6,792) – – 72,183
Common stock dividends declared – – – – (588,880) – (588,880)
Preferred dividend requirements
of subsidiaries(a) (20,933) – – – – – (20,933)
Balance at December 31, 2011 $ 94,000 $ 2,548 ($ 5,680,468) $ 5,360,682 $ 9,446,960 ($ 168,452) $ 9,055,270
Consolidated net income(a) 21,690 – – – 846,673 – 868,363
Other comprehensive loss – – – – – (124,631) (124,631)
Common stock issuances
related to stock plans – – 105,649 (2,830) – – 102,819
Common stock dividends declared – – – – (589,042) – (589,042)
Preferred dividend requirements
of subsidiaries(a) (21,690) – – – – – (21,690)
Balance at December 31, 2012 $ 94,000 $ 2,548 ($ 5,574,819) $ 5,357,852 $ 9,704,591 ($ 293,083) $ 9,291,089
Consolidated net income(a) 18,670 – – – 711,902 – 730,572
Other comprehensive income – – – – – 263,759 263,759
Common stock issuances
related to stock plans – – 40,877 10,279 – – 51,156
Common stock dividends declared – – – – (591,440) – (591,440)
Preferred dividend requirements
of subsidiaries(a) (18,670) – – – – – (18,670)
Balance at December 31, 2013 $ 94,000 $ 2,548 ($ 5,533,942) $ 5,368,131 $ 9,825,053 ($ 29,324) $ 9,726,466
(a) Consolidated net income and preferred dividend requirements of subsidiaries for 2013, 2012 and 2011 include $12.0 million, $15.0 million and $13.3 million, respectively, of preferred dividends
on subsidiaries’ preferred stock without sinking fund that is not presented as equity.
FINANCIAL HIGHLIGHTS
Consolidated Statements of Changes in Equity
(Unaudited)