Dominion Power 2008 Annual Report Download - page 17
Download and view the complete annual report
Please find page 17 of the 2008 Dominion Power annual report below. You can navigate through the pages in the report by either clicking on the pages listed below, or by using the keyword search tool below to find specific information within the annual report.-
 1
1 -
2
-
3
-
4
-
5
-
6
-
 7
7 -
 8
8 -
 9
9 -
 10
10 -
 11
11 -
 12
12 -
 13
13 -
 14
14 -
 15
15 -
 16
16 -
 17
17 -
 18
18 -
 19
19 -
 20
20 -
 21
21 -
 22
22 -
 23
23 -
 24
24 -
 25
25 -
 26
26 -
 27
27 -
28
-
29
-
30
-
31
-
32
-
33
-
34
-
35
-
36
 |
 |

2008 Dominion 15
from $3.88 per share in 2007. The 2007 results reflected one-time, after-tax
gains related to the sale of our non-Appalachian E&P operations.*
In late 2008, your Board of Directors approved a nearly 11 percent
increase in the common stock dividend, the second such increase in as many
years, following up on a 2007 pledge to achieve a 55 percent dividend
payout ratio by 2010. That would give us a ratio in line with that of our
utility peers.
Holding Our Own in Fearful Markets. Like that of most other
publicly traded companies, our total shareholder return suffered from market
conditions in 2008 that were perhaps the worst since the Great Depression. It
is worth noting, however, that Dominion’s shares fared better in 2008
than both our sector and the overall stock market. At year-end, our total return
was down by 21.5 percent from 2007. The Dow Jones Utility Average, a
group of 15 utility stocks including Dominion, was off 27.9 percent. The Dow
Jones Industrial Average dropped 31.9 percent, and the S&P 500 plunged
37.0 percent.
The credit markets were just as difficult as the equity markets.
In late 2008, we lowered previously announced 2009 operating earn-
ings-per-share targets in deference to increased costs of capital, expected
increases in pension and other benefits costs, and lower energy prices. We
reduced previous 2009 operating earnings targets of $3.30 -$3.45 per share
to $3.20-$3.30 per share.**
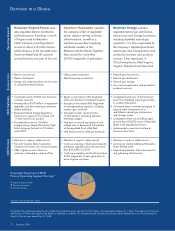
Total Return Comparison
Percent
Through Dec. 31, 2008
Dominion DJIADow Jones Utility S&P 500
-21.5
3.3
34.9
-31.9
-11.8 -5.5
-27.9
1.0
64.4
-37.0
-23.0
-10.5
Source: Bloomberg
1 Year Total Return
3 Year Total Return
5 Year Total Return
* Turn to page 30 for an explanation of the differences in 2008 GAAP earnings and operating earnings.
** Management cannot estimate the impact, if any, of differences in our expected 2009 operating earnings and GAAP earnings.