Dominion Power 2008 Annual Report Download - page 11
Download and view the complete annual report
Please find page 11 of the 2008 Dominion Power annual report below. You can navigate through the pages in the report by either clicking on the pages listed below, or by using the keyword search tool below to find specific information within the annual report.-
 1
1 -
 2
2 -
 3
3 -
 4
4 -
 5
5 -
 6
6 -
 7
7 -
 8
8 -
 9
9 -
 10
10 -
 11
11 -
 12
12 -
 13
13 -
 14
14 -
 15
15 -
 16
16 -
 17
17 -
 18
18 -
 19
19 -
 20
20 -
 21
21 -
 22
22 -
23
-
24
-
25
-
26
-
27
-
28
-
29
-
30
-
31
-
32
-
33
-
34
-
35
-
36
 |
 |

2008 Dominion 9
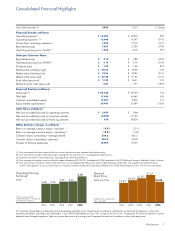
(1) Prior year amount has been recast to reflect our current derivative income statement classification policy.
(2) Prior year amount includes a $3.6 billion gain resulting from the sale of our U.S. non-Appalachian E&P business.
(3) Based on Non-GAAP Financial Measures. See page 30 for GAAP Reconciliations.
(4) Prior year amount has been recast to reflect the impact of adopting FSP FIN 39-1, Amendment of FASB Interpretation No. 39, Offsetting of Amounts Related to Certain Contracts.
(5) Prior year amounts include the impact of the sale of our U.S. non-Appalachian E&P business and our debt and equity tender offers. See Liquidity and Capital Resources
in Item 7. Management’s Discussion and Analysis of Financial Condition and Results of Operations (MD&A) of our 2008 Annual Report on Form 10-K for more information.
Year Ended December 31, 2008 2007 % Change
Financial Results (millions)
Operating revenue(1) $ 16,290 $ 14,816 9.9%
Operating expenses (1) (2) 12,664 9,247 37.0%
Income from continuing operations 1,836 2,705 –32.1%
Reported earnings 1, 8 3 4 2,539 – 2 7. 8 %
Operating earnings (non-GAAP)(3) 1, 8 3 4 1, 6 78 9. 3%
Data per Common Share
Reported earnings $ 3.16 $ 3.88 –18.6%
Operating earnings (non-GAAP)(3) $ 3.16 $ 2.56 23.4%
Dividends paid $ 1.58 $ 1. 4 6 8.2%
Market value (intraday high) $ 48.50 $ 49.38 –1.8%
Market value (intraday low) $ 31.26 $ 39.84 –21.5%
Market value (year-end) $ 35.84 $ 4 7. 4 5 –24.5%
Book value (year- end) $ 17.28 $ 16.31 5.9%
Market to book value (year- end) 2.07 2.91 –28.9%
Financial Position (millions)
Total assets (4) $ 42,053 $ 39,139 7. 4 %
Total debt 1 7, 4 3 0 16,469 5.8%
Common shareholders’ equity 10,077 9, 4 06 7. 1 %
Equity market capitalization 20,901 2 7, 3 6 9 –23.6%
Cash Flows (millions)(5)
Net cash provided by (used in) operating activities $ 2,659 $ (246)
Net cash provided by (used in) investing activities (3,490) 10,192
Net cash provided by (used in) financing activities 615 (9,801)
Other Statistics (shares in millions)
Return on average common equity—reported 18.8% 22.1%
Return on average common equity—operating(3) 18.8% 14.6%
Common shares outstanding—average, diluted 580.8 655.2
Common shares outstanding—year-end 583.2 576.8
Number of full-time employees 18,000 17,000
Consolidated Financial Highlights
Year-end
Stock Price
Dollars per Share
20082004 2005 20072006
33.87*
38.60* 41.92*
47.45
35.84
*Reflects the November 2007
2-for-1 stock split
✚▲◆
✚
Operating Earnings
Per Share*
Dollars
20082004 2005 20072006
2.28 2.26 2.53 2.56
3.16
* Based on Non-GAAP
Financial Measures. See page 30
for GAAP reconciliations.
✚▲◆
This Summary Annual Report includes financial and operating highlights which should not be considered a substitute for our full financial statements, inclusive of
footnotes and MD&A, provided to all shareholders in our 2008 Annual Report on Form 10-K. A copy of the Form 10-K, including the full financial statements, can be
obtained free of charge through our Web site at www.dom.com or by writing to our Corporate Secretary at the address on the inside back cover.