Dollar General 2012 Annual Report Download - page 40
Download and view the complete annual report
Please find page 40 of the 2012 Dollar General annual report below. You can navigate through the pages in the report by either clicking on the pages listed below, or by using the keyword search tool below to find specific information within the annual report.-
 1
1 -
2
-
3
-
4
-
5
-
6
-
7
-
8
-
9
-
10
-
11
-
12
-
13
-
14
-
15
-
16
-
17
-
18
-
19
-
20
-
21
-
22
-
23
-
24
-
25
-
26
-
27
-
28
-
29
-
 30
30 -
 31
31 -
 32
32 -
 33
33 -
 34
34 -
 35
35 -
 36
36 -
 37
37 -
 38
38 -
 39
39 -
 40
40 -
 41
41 -
 42
42 -
 43
43 -
 44
44 -
 45
45 -
 46
46 -
 47
47 -
 48
48 -
 49
49 -
 50
50 -
51
-
52
-
53
-
54
-
55
-
56
-
57
-
58
-
59
-
60
-
61
-
62
-
63
-
64
-
65
-
66
-
67
-
68
-
69
-
70
-
71
-
72
-
73
-
74
-
75
-
76
-
77
-
78
-
79
-
80
-
81
-
82
-
83
-
84
-
85
-
86
-
87
-
88
-
89
-
90
-
91
-
92
-
93
-
94
-
95
-
96
-
97
-
98
-
99
-
100
-
101
-
102
-
103
-
104
-
105
-
106
-
107
-
108
-
109
-
110
-
111
-
112
-
113
-
114
-
115
-
116
-
117
-
118
-
119
-
120
-
121
-
122
-
123
-
124
-
125
-
126
-
127
-
128
-
129
-
130
-
131
-
132
-
133
-
134
-
135
-
136
-
137
-
138
-
139
-
140
-
141
-
142
-
143
-
144
-
145
-
146
-
147
-
148
-
149
-
150
-
151
-
152
-
153
-
154
-
155
-
156
-
157
-
158
-
159
-
160
-
161
-
162
-
163
-
164
-
165
-
166
-
167
-
168
-
169
-
170
-
171
-
172
-
173
-
174
-
175
-
176
-
177
-
178
-
179
-
180
-
181
-
182
-
183
-
184
-
185
-
186
-
187
-
188
-
189
-
190
-
191
-
192
-
193
-
194
-
195
-
196
-
197
 |
 |

Proxy
at 20.45%, or 50 basis points lower than the target level, and the 200% achievement level was set at
21.95%, or 100 basis points higher than the threshold level.
The bonus payable to each named executive officer if we reached the 2012 target performance
levels for each of the financial performance measures is equal to the applicable percentage of salary as
set forth in the chart below. For all named executive officers, such percentages are consistent with
those for the prior year. In addition, for all named executive officers, such percentages reflect a blend
of the approximate median of the payout percentages for the market comparator group (other than for
the CEO for whom the market value was not blended). Mr. Dreiling’s employment agreement with us
requires minimum threshold (50%) and minimum target (125%) bonus percentages, but in 2011 the
Committee determined his target bonus percentage should be 130% in order to more closely align
Mr. Dreiling’s bonus target and total cash compensation with the median of the market comparator
group.
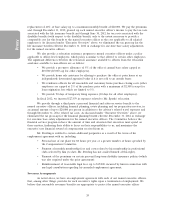
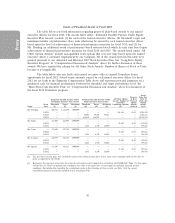
Name Target Payout Percentage
Mr. Dreiling 130%
Mr. Tehle 65%
Mr. Vasos 65%
Ms. Lanigan 65%
Mr. Sparks 65%
Bonus payments for financial performance below or above the applicable target levels are
prorated on a graduated scale commensurate with financial performance levels in accordance with the
schedule below. For 2012, the ROIC graduated scale was modified to more closely align the ROIC
achievement levels with the EBITDA achievement levels.
Adjusted EBITDA ROIC Total
% of % of % of % of
Performance Bonus Performance Bonus Bonus at
Target Payable Target Payable Target (%)
95 45 97.61 5 50
96 54 98.09 6 60
97 63 98.57 7 70
98 72 99.05 8 80
99 81 99.52 9 90
100 90 100.00 10 100
101 99 100.48 11 110
102 108 100.95 12 120
103 117 101.43 13 130
104 126 101.91 14 140
105 135 102.39 15 150
106 144 102.86 16 160
107 153 103.34 17 170
108 162 103.82 18 180
109 171 104.30 19 190
110 180 104.77 20 200
For each 1% adjusted EBITDA increase in the percent of performance target level between
the threshold performance level and 110% of the target performance level, the corresponding payout
increases by 9% of the officer’s target payout amount (based upon the officer’s target payout
percentage). For each 1% adjusted EBITDA increase above 110% of the target performance level, the
corresponding payout increases by 10.865% of the officer’s target payout amount (based upon the
33